Neobanking Market (2026 - 2035)

ID: MRFR/BS/10579-HCR 128 Pages Ankit Gupta Last Updated: October 12, 2026

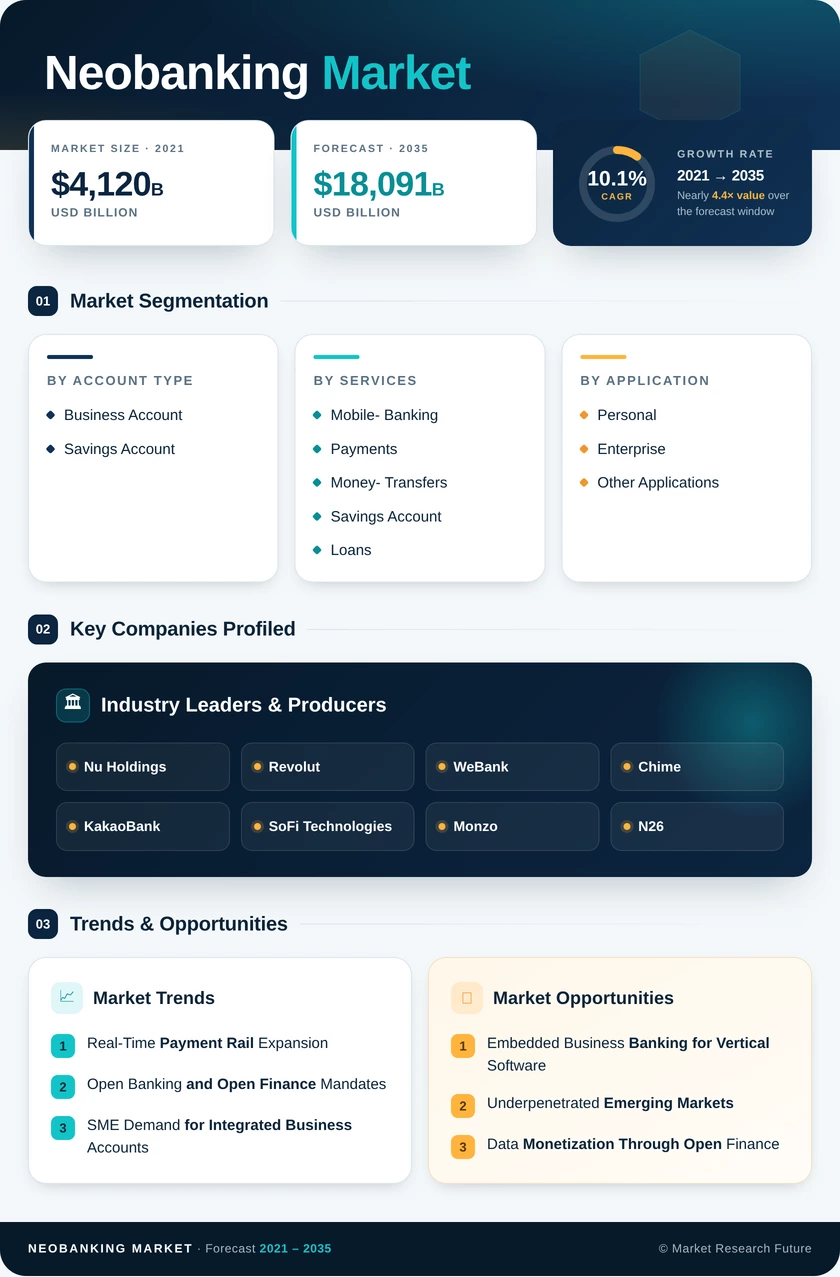
Neobanking Market Size, Share and Research Report By Account Type (Business Account, Savings Account), By Services (Mobile Banking, Payments, Money Transfers, Savings, Loans, Others), By Application (Personal, Enterprise, Others) and By Regional (North America, Europe, Asia-Pacific, South America, Middle East & Africa) - Industry Forecast to 2035.

Neobanking Market
Market Size
Forecast Period2026-2035
CAGR (2026-2035)10.1%
2025 Market SizeUSD 6,860 Billion
2035 Market SizeUSD 18,091 Billion
Key Players
Nu Holdings
Revolut
WeBank
Chime
KakaoBank
SoFi Technologies
Opportunities
  • Embedded Business Banking for Vertical Software
  • Underpenetrated Emerging Markets
  • Data Monetization Through Open Finance
  1. 1 Market Summary | |
  2. 2 Key Report Takeaways | |
    1. 2.1 By Account Type | |
    2. 2.2 By Services | |
    3. 2.3 By Application | |
    4. 2.4 By Region | |
  3. 3 Market Size and Forecast (2021–2035) | |
  4. 4 Driver Impact Analysis | |
    1. 4.1 Real-Time Payment Rail Expansion | |
    2. 4.2 Open Banking and Open Finance Mandates | |
    3. 4.3 SME Demand for Integrated Business Accounts | |
    4. 4.4 Digital Bank Licensing in Asia and the Gulf | |
    5. 4.5 AI-Driven Cash-Flow Underwriting | |
    6. 4.6 Financial Inclusion of Unbanked Adults | |
  5. 5 Restraints Impact Analysis | |
    1. 5.1 Thin Margins and Delayed Profitability | |
    2. 5.2 Financial-Crime Compliance Enforcement | |
    3. 5.3 Fraud Liability and Cyber-Resilience Costs | |
    4. 5.4 Sponsor-Bank and Safeguarding Risk | |
    5. 5.5 Tighter Venture Funding Conditions | |
  6. 6 Opportunities | |
    1. 6.1 Embedded Business Banking for Vertical Software | |
    2. 6.2 Underpenetrated Emerging Markets | |
    3. 6.3 Data Monetization Through Open Finance | |
    4. 6.4 Wealth and Insurance Cross-Sell | |
  7. 7 Regional Market Share and Country-Level Analysis | |
    1. 7.1 North America | | |
      1. 7.1.1 US | | |
      2. 7.1.2 Canada | | |
      3. 7.1.3 Mexico | |
    2. 7.2 Europe | | |
      1. 7.2.1 Germany | | |
      2. 7.2.2 UK | | |
      3. 7.2.3 France | | |
      4. 7.2.4 Italy | | |
      5. 7.2.5 Spain | | |
      6. 7.2.6 Nordic Countries | | |
      7. 7.2.7 Russia | | |
      8. 7.2.8 Rest of Europe | |
    3. 7.3 Asia-Pacific | | |
      1. 7.3.1 China | | |
      2. 7.3.2 India | | |
      3. 7.3.3 Japan | | |
      4. 7.3.4 South Korea | | |
      5. 7.3.5 ASEAN | | |
      6. 7.3.6 Rest of Asia-Pacific | |
    4. 7.4 South America | | |
      1. 7.4.1 Brazil | | |
      2. 7.4.2 Argentina | | |
      3. 7.4.3 Rest of South America | |
    5. 7.5 Middle East & Africa | | |
      1. 7.5.1 Saudi Arabia | | |
      2. 7.5.2 UAE | | |
      3. 7.5.3 South Africa | | |
      4. 7.5.4 Egypt | | |
      5. 7.5.5 Rest of MEA | |
  8. 8 Future Outlook (2026–2035) | |
    1. 8.1 AI Agents and Autonomous Money Management | |
    2. 8.2 Platform Economics and Super-App Convergence | |
    3. 8.3 Programmable Money and Real-Time Settlement | |
    4. 8.4 Operational Resilience as a Competitive Asset | |
  9. 9 Segmentation Analysis | |
    1. 9.1 By Account Type | | |
      1. 9.1.1 Business Account | | |
      2. 9.1.2 Savings Account | |
    2. 9.2 By Services | | |
      1. 9.2.1 Mobile-Banking | | |
      2. 9.2.2 Payments | | |
      3. 9.2.3 Money Transfers | | |
      4. 9.2.4 Savings Account | | |
      5. 9.2.5 Loans | | |
      6. 9.2.6 Others | |
    3. 9.3 By Application | | |
      1. 9.3.1 Personal | | |
      2. 9.3.2 Enterprise | | |
      3. 9.3.3 Other Application | |
  10. 10 Competitive Landscape | |
    1. 10.1 Market Concentration Analysis | |
    2. 10.2 Competitive Benchmarking Matrix | |
    3. 10.3 Company Profiles | | |
      1. 10.3.1 Nu Holdings | | |
      2. 10.3.2 Revolut | | |
      3. 10.3.3 WeBank | | |
      4. 10.3.4 Chime | | |
      5. 10.3.5 KakaoBank | | |
      6. 10.3.6 SoFi Technologies | | |
      7. 10.3.7 Monzo | | |
      8. 10.3.8 N26 | | |
      9. 10.3.9 Starling Bank | | |
      10. 10.3.10 Varo Bank | | |
      11. 10.3.11 Atom Bank | |
  11. 11 Recent News & Developments | |
  12. 12 Report Scope and Methodology | |
  13. 13 Detailed Sources and Citations | |
  14. 14 Frequently Asked Questions (FAQs) | | LIST OF TABLES | |
  15. TABLE 1 Global Market Snapshot, 2025–2035 | |
  16. TABLE 2 Global Market Size & Forecast, by Revenue (USD Billion), 2021–2035 | |
  17. TABLE 3 Driver Impact Analysis, 2026–2035 | |
  18. TABLE 4 Restraints Impact Analysis, 2026–2035 | |
  19. TABLE 5 Market Size, by Region, 2025 | |
  20. TABLE 6 North America Market, by Country, 2025 | |
  21. TABLE 7 Europe Market, by Country, 2025 | |
  22. TABLE 8 Asia-Pacific Market, by Country, 2025 | |
  23. TABLE 9 South America Market, by Country, 2025 | |
  24. TABLE 10 Middle East & Africa Market, by Country, 2025 | |
  25. TABLE 11 Market Size, by Account Type, 2025 | |
  26. TABLE 12 Market Size, by Services, 2025 | |
  27. TABLE 13 Market Size, by Application, 2025 | |
  28. TABLE 14 Competitive Benchmarking Matrix, 2025 | |
  29. TABLE 15 Report Scope and Methodology | |
  30. TABLE 16 Detailed Sources and Citations | |
  31. TABLE 17 Segmentation Quick Reference | | LIST OF FIGURES | |
  32. FIGURE 1 Market Dynamics Overview (Drivers, Restraints, Opportunities) | |
  33. FIGURE 2 Industry Value Chain Analysis | |
  34. FIGURE 3 Porter's Five Forces Analysis | |
  35. FIGURE 4 Global Market Size Trend, 2021–2035 (USD Billion) | |
  36. FIGURE 5 Market Share, by Account Type, 2025 | |
  37. FIGURE 6 Market Share, by Services, 2025 | |
  38. FIGURE 7 Market Share, by Application, 2025 | |
  39. FIGURE 8 Regional Market Share, 2025 | |
  40. FIGURE 9 Regional Growth Comparison, 2026–2035 | |
  41. FIGURE 10 Competitive Landscape Positioning Map, 2025 | |
  42. FIGURE 11 Estimated Revenue Share Ranges of Key Players, 2025

Segmentation Quick Reference

DimensionSub-SegmentsDominant SegmentFastest Growing Segment
By Account TypeBusiness Account, Savings AccountBusiness Account (63.1% share)Savings Account (47.6% CAGR)
By ServicesMobile Banking, Payments, Money Transfers, Savings Account, Loans, OthersMobile-Banking (43.7% share)Loans (48.9% CAGR)
By ApplicationPersonal, Enterprise, Other ApplicationsEnterprise (64.8% share)Personal (51.3% CAGR)
By RegionNorth America, Europe, Asia-Pacific, South America, Middle East & AfricaEurope (36.0% share)Asia-Pacific (13.4% CAGR)


Market Segmentation Overview

By Account Type

Sub-SegmentKey Trend
Business AccountBundling of invoicing, payroll, expense cards, and accounting integrations
Savings AccountInstant-access products with competitive rates driving deposit growth


Business Account leads this dimension at a 63.1% share because SMEs keep larger balances and pay for treasury features that consumers rarely use. Savings Account grows fastest at a 47.6% CAGR as instant-access deposit rates draw idle balances away from incumbent current accounts. The two reinforce each other: savings deposits fund the lending that business customers increasingly expect.

By Services

Sub-SegmentKey Trend
Mobile-BankingGateway service for onboarding and daily engagement
PaymentsReal-time rail integration and card spending growth
Money-TransfersTransparent FX pricing on cross-border corridors
Savings AccountGoal-based savings and automated round-ups
LoansAI cash-flow underwriting for small-ticket credit
OthersWealth, insurance, and crypto features under one login


Mobile-Banking holds the largest share at 43.7% because it is the first service nearly every customer activates. Loans expand fastest at a 48.9% CAGR as transaction-based models approve credit in seconds and real-time rails support micro-repayments. Payments and Money Transfers increase usage frequency, which feeds the data those lending models depend on.

By Application

Sub-SegmentKey Trend
PersonalFeature parity with incumbents plus budgeting and savings tools
EnterpriseAutomated payables, receivables, and cash-flow forecasting
Other ApplicationDigital treasury for non-profits and institutions


Enterprise dominates with a 64.8% share since businesses pay for analytics and payroll integrations that embed the account in daily operations. Personal grows fastest at a 51.3% CAGR as overdrafts, insurance, and savings goals close the gap with legacy banks. Other Application remains small, but institutional adoption of digital treasury adds a steady, low-churn revenue stream.


Download PDF ×

We do not share your information with anyone. However, we may send you emails based on your report interest from time to time. You may contact us at any time to opt-out.