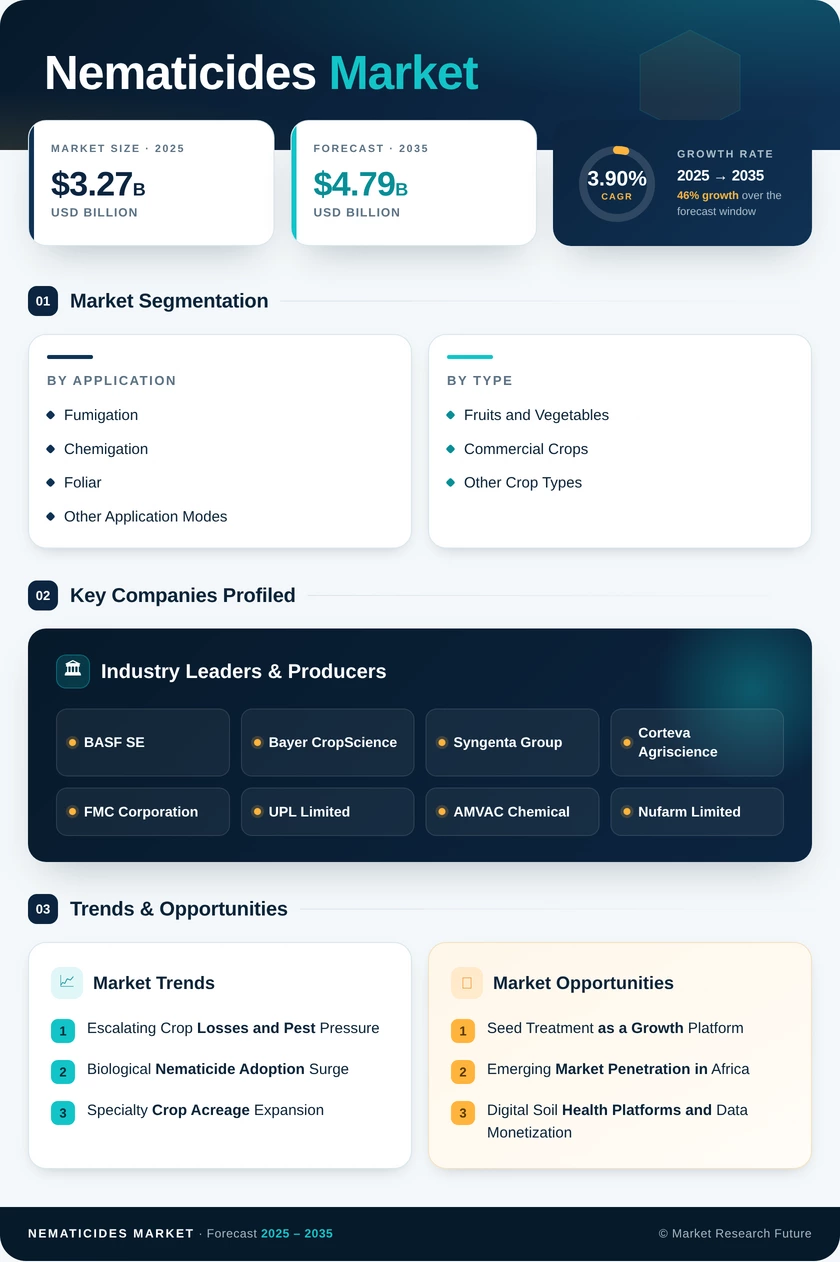
Nematicides Market (2026 - 2035)

Nematicides Market Size, Share, Industry Trend & Analysis Research Report Information By Application Mode (Fumigation, Chemigation, Foliar, Other Application Modes), By Crop Type (Fruits and Vegetables, Commercial Crops, Other Crop Types), By Region (North America, Europe, Asia-Pacific, South America, Middle East & Africa) - Forecast till 2035

Forecast Period
2026-2035
CAGR
3.90%
2025 Market Size
USD 3.27 Billion
2035 Market Size
USD 4.79 Billion
Agriculture ● Updated July 2026 Report ID: MRFR/Agri/3735-CR | Pages: 186 | Author: Snehal Singh, Sakshi Gupta
  1. 1 Market Overview |
    1. 1.1 Study Assumptions & Market Definition |
    2. 1.2 Scope of the Study |
    3. 1.3 Research Methodology
  2. 2 Market Summary & Key Takeaways
  3. 3 Market Dynamics |
    1. 3.1 Market Drivers Analysis | |
      1. 3.1.1 Escalating Crop Losses and Pest Pressure | |
      2. 3.1.2 Biological Nematicide Adoption Surge | |
      3. 3.1.3 Specialty Crop Acreage Expansion | |
      4. 3.1.4 Precision Application Technologies | |
      5. 3.1.5 Regulatory Phase-Out Replacement Demand | |
      6. 3.1.6 Climate Change Expanding Nematode Range | |
      7. 3.1.7 Government Subsidies for Sustainable Crop Protection |
    2. 3.2 Market Restraints Analysis | |
      1. 3.2.1 Regulatory Bans and Active Ingredient Restrictions | |
      2. 3.2.2 Environmental and Groundwater Contamination Concerns | |
      3. 3.2.3 High Cost of Biological Alternatives | |
      4. 3.2.4 Smallholder Farmer Adoption Barriers | |
      5. 3.2.5 Resistance Development in Target Nematode Populations |
    3. 3.3 Market Opportunity Analysis | |
      1. 3.3.1 Seed Treatment as a Growth Platform | |
      2. 3.3.2 Emerging Market Penetration in Africa | |
      3. 3.3.3 Digital Soil Health Platforms and Data Monetization | |
      4. 3.3.4 Regulatory Tailwinds in Biological Product Registration | |
      5. 3.3.5 Climate Adaptation and Resistant Cultivar Pairing |
    4. 3.4 Industry Value Chain Analysis |
    5. 3.5 Porter's Five Forces Analysis
  4. 4 Global Nematicides Market Size & Forecast (2021–2035) |
    1. 4.1 Historical Market Size (2021–2025) |
    2. 4.2 Current & Forecast Market Size (2026–2035) |
    3. 4.3 Market Size by Revenue (USD Billion) |
    4. 4.4 Year-over-Year Growth Analysis
  5. 5 Segmentation Analysis |
    1. 5.1 By Application Mode | |
      1. 5.1.1 Fumigation | |
      2. 5.1.2 Chemigation | |
      3. 5.1.3 Foliar | |
      4. 5.1.4 Other Application Modes |
    2. 5.2 By Crop Type | |
      1. 5.2.1 Fruits and Vegetables | |
      2. 5.2.2 Commercial Crops | |
      3. 5.2.3 Other Crop Types
  6. 6 Regional Analysis |
    1. 6.1 North America | |
      1. 6.1.1 United States | |
      2. 6.1.2 Canada | |
      3. 6.1.3 Mexico |
    2. 6.2 Europe | |
      1. 6.2.1 Germany | |
      2. 6.2.2 United Kingdom | |
      3. 6.2.3 France | |
      4. 6.2.4 Italy | |
      5. 6.2.5 Spain | |
      6. 6.2.6 Nordic Countries | |
      7. 6.2.7 Russia | |
      8. 6.2.8 Rest of Europe |
    3. 6.3 Asia-Pacific | |
      1. 6.3.1 China | |
      2. 6.3.2 India | |
      3. 6.3.3 Japan | |
      4. 6.3.4 South Korea | |
      5. 6.3.5 ASEAN | |
      6. 6.3.6 Rest of Asia-Pacific |
    4. 6.4 South America | |
      1. 6.4.1 Brazil | |
      2. 6.4.2 Argentina | |
      3. 6.4.3 Rest of South America |
    5. 6.5 Middle East & Africa | |
      1. 6.5.1 Saudi Arabia | |
      2. 6.5.2 UAE | |
      3. 6.5.3 South Africa | |
      4. 6.5.4 Egypt | |
      5. 6.5.5 Rest of MEA
  7. 7 Competitive Landscape |
    1. 7.1 Market Share Analysis (2025) |
    2. 7.2 Competitive Benchmarking Matrix |
    3. 7.3 Company Profiles | |
      1. 7.3.1 BASF SE | |
      2. 7.3.2 Bayer CropScience | |
      3. 7.3.3 Syngenta Group | |
      4. 7.3.4 Corteva Agriscience | |
      5. 7.3.5 FMC Corporation | |
      6. 7.3.6 UPL Limited | |
      7. 7.3.7 AMVAC Chemical | |
      8. 7.3.8 Nufarm Limited | |
      9. 7.3.9 Certis Biologicals | |
      10. 7.3.10 Bioceres Crop Solutions
  8. 8 Future Outlook & Strategic Recommendations (2026–2035) |
    1. 8.1 Biological Revolution and Microbiome-Based Solutions |
    2. 8.2 AI-Driven Precision Pest Management |
    3. 8.3 Sustainability Reporting and ESG Integration |
    4. 8.4 Climate Resilience and Adaptive Pest Strategies
  9. 9 Recent Developments & News
  10. 10 Frequently Asked Questions (FAQs)
  11. 11 Report Scope & Methodology |
    1. 11.1 Study Period & Base Year |
    2. 11.2 Data Sources & Citations |
    3. 11.3 Abbreviations
  12. 1 LIST OF TABLES |
  13. TABLE 1 Global Nematicides Market Size & Forecast, by Revenue (USD Billion), 2021–2035 |
  14. TABLE 2 Global Nematicides Market — Year-over-Year Growth Analysis, 2021–2035 |
  15. TABLE 3 Global Nematicides Market — Driver Impact Analysis, 2026–2035 |
  16. TABLE 4 Global Nematicides Market — Restraint Impact Analysis, 2026–2035 |
  17. TABLE 5 Global Nematicides Market Size, by Application Mode, 2021–2035 (USD Billion) |
  18. TABLE 6 Global Nematicides Market Size, by Crop Type, 2021–2035 (USD Billion) |
  19. TABLE 7 Global Nematicides Market Size, by Region, 2021–2035 (USD Billion) |
  20. TABLE 8 North America Nematicides Market Size, by Country, 2021–2035 (USD Billion) |
  21. TABLE 9 Europe Nematicides Market Size, by Country, 2021–2035 (USD Billion) |
  22. TABLE 10 Asia-Pacific Nematicides Market Size, by Country, 2021–2035 (USD Billion) |
  23. TABLE 11 South America Nematicides Market Size, by Country, 2021–2035 (USD Billion) |
  24. TABLE 12 Middle East & Africa Nematicides Market Size, by Country, 2021–2035 (USD Billion) |
  25. TABLE 13 Competitive Benchmarking Matrix — Global Nematicides Market, 2025 |
  26. TABLE 14 Company Profiles — Key Players, Global Nematicides Market |
  27. TABLE 15 Recent Developments & Strategic Announcements, 2023–2025 |
  28. TABLE 16 Report Scope & Methodology Summary |
  29. TABLE 17 Detailed Sources and Citations
  30. 2 LIST OF FIGURES |
  31. FIGURE 1 Global Nematicides Market Dynamics (Drivers, Restraints, Opportunities) |
  32. FIGURE 2 Value Chain Analysis — Nematicides Industry |
  33. FIGURE 3 Porter's Five Forces Analysis — Nematicides Market |
  34. FIGURE 4 Global Nematicides Market Size Trend (USD Billion), 2021–2035 |
  35. FIGURE 5 Nematicides Market Share, by Application Mode (%), 2025 |
  36. FIGURE 6 Nematicides Market Share, by Crop Type (%), 2025 |
  37. FIGURE 7 Nematicides Market Share, by Region (%), 2025 |
  38. FIGURE 8 North America Nematicides Market Size Trend (USD Billion), 2021–2035 |
  39. FIGURE 9 Europe Nematicides Market Size Trend (USD Billion), 2021–2035 |
  40. FIGURE 10 Asia-Pacific Nematicides Market Size Trend (USD Billion), 2021–2035 |
  41. FIGURE 11 South America Nematicides Market Size Trend (USD Billion), 2021–2035 |
  42. FIGURE 12 Middle East & Africa Nematicides Market Size Trend (USD Billion), 2021–2035 |
  43. FIGURE 13 Competitive Landscape — Market Share Distribution, 2025 |
  44. FIGURE 14 Competitive Positioning Matrix — Key Players, Nematicides Market
Share::
Request Free Sample

Segmentation Quick Reference

DimensionSub-SegmentsDominant SegmentFastest Growing Segment
By Application ModeFumigation, Chemigation, Foliar, Other Application ModesFumigationChemigation
By Crop TypeFruits and Vegetables, Commercial Crops, Other Crop TypesFruits and VegetablesCommercial Crops
By RegionNorth America, Europe, Asia-Pacific, South America, Middle East & AfricaNorth AmericaAsia-Pacific


Market Segmentation Overview

By Application Mode

Sub-SegmentKey Trend
FumigationDominant method facing regulatory headwinds in the EU and California; gradual share erosion expected
ChemigationFastest-growing mode driven by global drip irrigation infrastructure expansion
FoliarGaining traction through drone-based precision application platforms
Other Application ModesSeed treatment and in-furrow granular methods gaining share in row crop segments


Fumigation continues to anchor the application mode landscape, particularly for pre-plant soil preparation in high-value crops. Chemigation is steadily displacing legacy broadcast methods as precision irrigation adoption accelerates across water-scarce regions, and foliar application is evolving rapidly through drone and autonomous-vehicle delivery platforms.

By Crop Type

Sub-SegmentKey Trend
Fruits and VegetablesLargest segment by value; driven by export-quality standards and high pest susceptibility
Commercial CropsFastest-growing type; soybean and cotton acreage expansion in South America and the U.S. driving demand
Other Crop TypesTurf, ornamental, and forestry applications represent a stable but niche demand segment


Fruits and vegetables account for nearly half of global nematicide demand, reflecting the disproportionate economic damage nematodes inflict on high-value horticultural crops. Commercial crops are closing the gap as row-crop growers increasingly recognize the yield-protection value of nematicide programs, particularly for soybean cyst nematode management in the Americas.


 

Share::
Request Free Sample
Download PDF ×

We do not share your information with anyone. However, we may send you emails based on your report interest from time to time. You may contact us at any time to opt-out.