ID: MRFR/MED/0448-CR | July 2019 | Region: Global | 117 pages
Market Overview
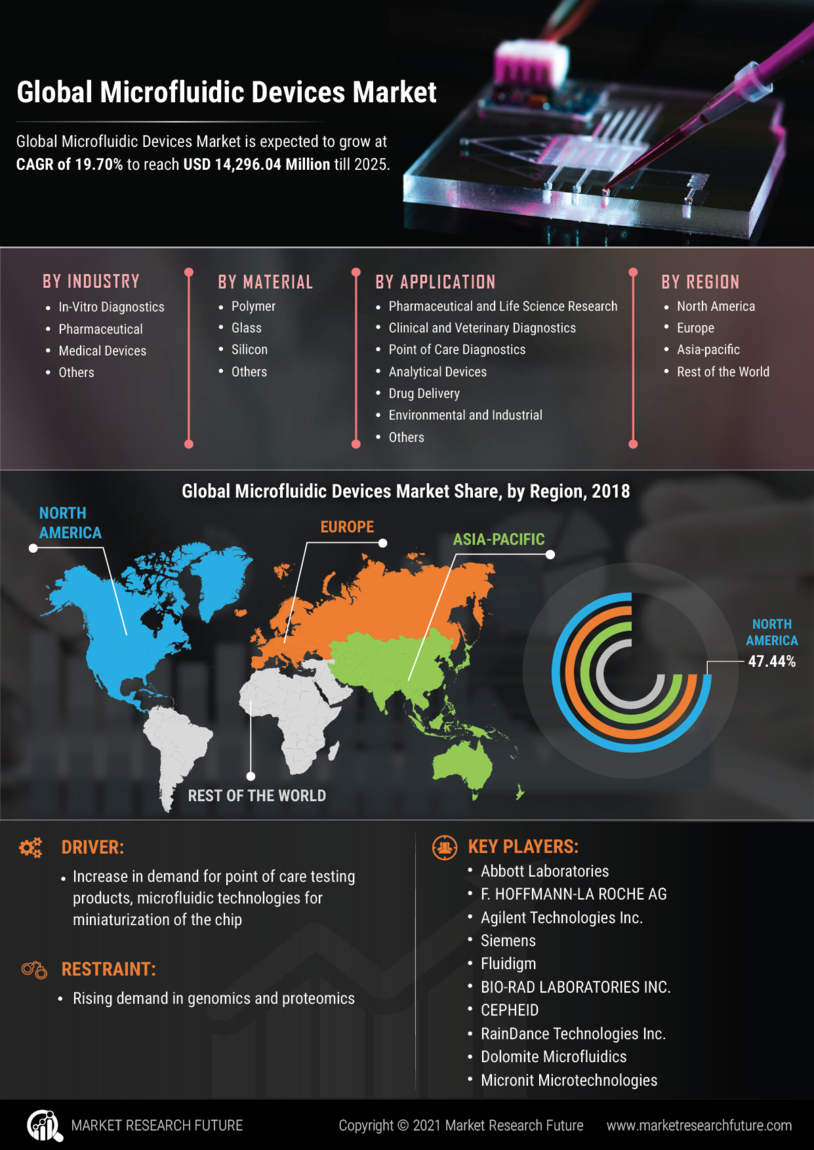
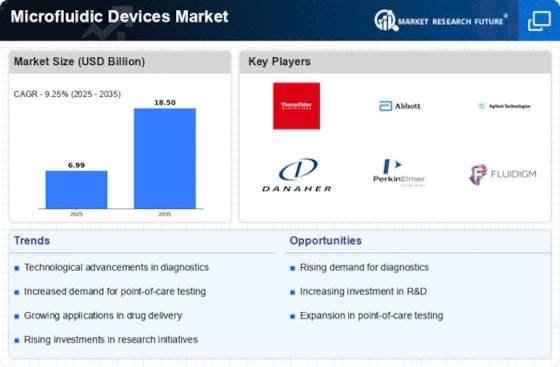
The Global Microfluidic Devices Market is expected to grow at CAGR of 19.70% to reach USD 14,296.04 Million till 2025. Microfluidic device is a technology that allows integration of many medical tests on a single chip. It has become an essential technology for integration, industrialization, miniaturization, and parallelization of various tests in the fields of diagnostics, drug development, and biological research.
The global microfluidic devices market is mainly driven by the increase in demand for point of care testing products, microfluidic technologies for miniaturization of the chip, and rising demand in genomics and proteomics. However, stringent government policies may slow the growth of the market.
Market Dynamics
Rising technological advancements is one of the key factors driving the microfluidic device market. In January 2019, L’Oréal introduced a prototype of a wearable sensor and companion app from the L’Oréal Technology Incubator at the 2019 Consumer Electronics Show. My Skin Track pH by La Roche-Posay is the first wearable microfluidic sensor and companion app to easily measure personal skin pH levels and create customized product regimens to better care for the skin.
Increasing demand for point-of-care (POCT) testing is also strongly impacting the growth of the market. POCT involves the performance of a test close to the site of patient care to provide immediate results outside the conventional laboratory environment. Diagnostics companies, such as Abbott Point of Care, Alere, BD Diagnostics, Cepheid, and Abaxis, have recognized the potential of quick molecular diagnostic testing and launched several successful points of care products based on microfluidic technology in the past few years. The development and adoption of these clinical tests are expected to drive demand for microfluidic devices.
Global Microfluidic Devices Market Revenue, by Application, 2018 (%)
Sources: MRFR Analysis
Segmentation
Based on industry, the global microfluidic devices market has been segmented into in-vitro diagnostics, pharmaceutical, medical devices, and others. The pharmaceutical segment includes chips for lab analytics, accurate dispensing devices, and micro-reactors for drug synthesis. Medical devices segment includes micro-pumps and dispensing system, inhalers, micro-needles, and others.
In-vitro diagnostics is the leading segment which holds a share of 50.6% in 2018. The vast market share of in-vitro diagnostics is due to rising demand for early diagnosis. IVD tests are carried out outside the human body in an artificial environment by using samples such as blood, saliva, and tissue for analysis.
The global microfluidic devices market, by material, has been segmented into polymer, glass, silicon, and others. The polymer segment accounts for a significant share in the global microfluidic devices market, by the material. Polymers are cheaper material and allow for quick fabrication processes in comparison to silicon and glass. Polystyrene, polyvinyl chloride, polymethyl-methacrylate-pmma-market-4864'>polymethyl methacrylate, cyclic olefin copolymer, polycarbonate, and polydimethylsiloxane (PDMS) are some of the polymers which are used for the prototyping microfluidic devices fabrication of microfluidic chips.
Based on the application, the market has been segregated into pharmaceutical and life science research, clinical and veterinary diagnostics, point of care diagnostics, analytical devices, drug delivery, environmental and industrial, and others.
Global Microfluidic Devices Market Share, by Region, 2018 (%)
Sources: MRFR Analysis
Regional Analysis
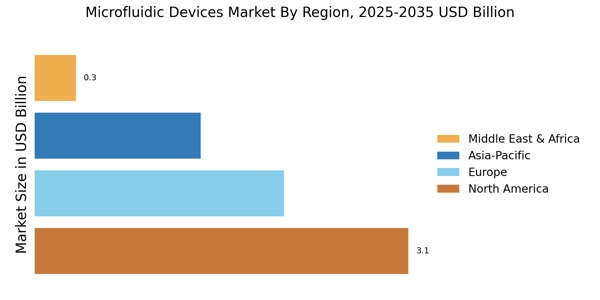
The global microfluidic devices market has been mainly categorized into the Americas, Europe, Asia-Pacific, and the Middle East & Africa.
The Americas dominate the global microfluidic devices market, owing to the growing geriatric population, increasing healthcare awareness, rising chronic and lifestyle diseases, and technological developments for various home use applications and more extensive insurance infrastructure facilities driving the growth of microfluidic devices.
The European microfluidic devices market has been segmented into Western Europe and Eastern Europe. In 2018, it was estimated that Europe stood second in the global microfluidic devices market. Technological advancements and rising participation of market players will support the growth of Europe microfluidic devices market. For instance, a UK-based firm, Dolomite Bio launched the game-changing Nadia single cell platform, offering the fast-growing single cell research sector an innovative solution for a wide range of potential applications.
Asia-Pacific is expected to register the highest CAGR during the forecast period. Companies are introducing new technologically advanced products in this region, which is boosting the Asia-Pacific microfluidic devices market. In 2016, Samsung introduced a wearable all-in-one chip for monitoring and processing health data.
On the other hand, the Middle East & Africa holds the least share in the global microfluidic devices market due to the low economic development, especially within the African region.
Key Players
The prominent players in the global microfluidic devices market are Abbott Laboratories, F. HOFFMANN-LA ROCHE AG, Agilent Technologies, Inc., Siemens, Fluidigm, BIO-RAD LABORATORIES, INC., CEPHEID, RainDance Technologies, Inc., Dolomite Microfluidics, Micronit Microtechnologies, Johnson & Johnson Services, Inc., BD, Elveflow, Perkinelmer Inc., Thermo Fisher Scientific Inc., and BioMérieux.
Some of the key strategies followed by the players operating in the global microfluidic devices market were innovation, product development, acquisition, and expansion.
Market Segmentation
Global Microfluidic Devices Market, by Industry
Global Microfluidic Devices Market, by Material
Global Microfluidic Devices Market, by Application
Global Microfluidic Devices Market, by Region
Intended Audience
Report Attribute/Metric | Details |
---|---|
Market Size | USD 14,296.04 Million |
CAGR | 19.70% |
Base Year | 2019 |
Forecast Period | 2020-2027 |
Historical Data | 2018 |
Forecast Units | Value (USD Million) |
Report Coverage | Revenue Forecast, Competitive Landscape, Growth Factors, and Trends |
Segments Covered | Industry, Material and Application |
Geographies Covered | North America, Europe, Asia-Pacific, and Rest of the World (RoW) |
Key Vendors | Abbott Laboratories, F. HOFFMANN-LA ROCHE AG, Agilent Technologies, Inc., Siemens, Fluidigm, BIO-RAD LABORATORIES, INC., CEPHEID, RainDance Technologies, Inc., Dolomite Microfluidics, Micronit Microtechnologies, Johnson & Johnson Services, Inc., BD, Elveflow, Perkinelmer Inc., Thermo Fisher Scientific Inc., and BioMérieux |
Key Market Opportunities | The development and adoption of clinical tests are expected to drive demand for microfluidic devices. |
Key Market Drivers |
|
Frequently Asked Questions (FAQ) :
The global microfluidic devices market is predicted to touch USD 14, 296.04 million by 2025.
The microfluidic devices market is predicted to grow at a 19.70% CAGR between 2020-2027.
The Americas is predicted to have lions share in the microfluidic devices market during the forecast period.
Increasing use in proteomics and genomics and growing demand for point of care testing products is boosting market growth.
Strict government policies may hamper the microfluidic devices market growth.
1 Report Prologue
2 Market Introduction
2.1 Definition
2.2 Scope of the Study
2.2.1 Research Objective
2.2.2 Assumptions
2.2.3 Limitations
3 Research Methodology
3.1 Introduction
3.2 Primary Research
3.3 Secondary Research
3.4 Market Size Estimation
4 Market Dynamics
4.1 Drivers
4.2 Restraints
4.3 Opportunities
4.4 Macroeconomic Indicators
4.5 Trends & Assessment
5 Market Factor Analysis
5.1 Porter’s Five Forces Analysis
5.1.1 Bargaining Power of Suppliers
5.1.2 Bargaining Power of Buyers
5.1.3 Threat of New Entrants
5.1.4 Threat of Substitutes
5.1.5 Intensity of Rivalry
5.2 Value Chain Analysis
5.3 Investment Opportunities
6 Microfluidics Devices Market, by Industry
6.1 Introduction
6.2 In-Vitro Diagnostics
Market Estimates & Forecast, by Region, 2020–2027
Market Estimates & Forecast, by Country, 2020–2027
6.3 Pharmaceutical
6.3.1 Chips for Lab Analytics
Market Estimates & Forecast, by Region, 2020–2027
Market Estimates & Forecast, by Country, 2020–2027
6.3.2 Accurate Dispensing Devices
Market Estimates & Forecast, by Region, 2020–2027
Market Estimates & Forecast, by Country, 2020–2027
6.3.3 Micro-reactors for Drug Synthesis
Market Estimates & Forecast, by Region, 2020–2027
Market Estimates & Forecast, by Country, 2020–2027
6.4 Medical Devices
6.4.1 Micro Pumps and Dispensing System
Market Estimates & Forecast, by Region, 2020–2027
Market Estimates & Forecast, by Country, 2020–2027
6.4.2 Inhalers
Market Estimates & Forecast, by Region, 2020–2027
Market Estimates & Forecast, by Country, 2020–2027
6.4.3 Micro-Needles
Market Estimates & Forecast, by Region, 2020–2027
Market Estimates & Forecast, by Country, 2020–2027
6.4.4 Others
Market Estimates & Forecast, by Region, 2020–2027
Market Estimates & Forecast, by Country, 2020–2027
6.5 Others
Market Estimates & Forecast, by Region, 2020–2027
Market Estimates & Forecast, by Country, 2020–2027
7 Microfluidics Devices Market, by Material
7.1 Introduction
7.2 Polymer
Market Estimates & Forecast, by Region, 2020–2027
Market Estimates & Forecast, by Country, 2020–2027
7.3 Glass
Market Estimates & Forecast, by Region, 2020–2027
Market Estimates & Forecast, by Country, 2020–2027
7.4 Silicon
Market Estimates & Forecast, by Region, 2020–2027
Market Estimates & Forecast, by Country, 2020–2027
7.5 Others
Market Estimates & Forecast, by Region, 2020–2027
Market Estimates & Forecast, by Country, 2020–2027
8 Microfluidics Devices Market, by Application
8.1 Introduction
8.2 Pharmaceutical and Life Science Research
Market Estimates & Forecast, by Region, 2020–2027
Market Estimates & Forecast, by Country, 2020–2027
8.3 Clinical and Veterinary Diagnostics
Market Estimates & Forecast, by Region, 2020–2027
Market Estimates & Forecast, by Country, 2020–2027
8.4 Point of Care Diagnostics
Market Estimates & Forecast, by Region, 2020–2027
Market Estimates & Forecast, by Country, 2020–2027
8.5 Analytical Devices
Market Estimates & Forecast, by Region, 2020–2027
Market Estimates & Forecast, by Country, 2020–2027
8.6 Drug Delivery
Market Estimates & Forecast, by Region, 2020–2027
Market Estimates & Forecast, by Country, 2020–2027
8.7 Environmental and Industrial
Market Estimates & Forecast, by Region, 2020–2027
Market Estimates & Forecast, by Country, 2020–2027
8.8 Others
Market Estimates & Forecast, by Region, 2020–2027
Market Estimates & Forecast, by Country, 2020–2027
9 Global Microfluidics Devices Market, by Region
9.1 Introduction
9.2 Americas
Microfluidics Devices Market, by Industry
Microfluidics Devices Market, by Material
Microfluidics Devices Market, by Application
9.2.1 North America
Microfluidics Devices Market, by Industry
Microfluidics Devices Market, by Material
Microfluidics Devices Market, by Application
9.2.1.1 US
Microfluidics Devices Market, by Industry
Microfluidics Devices Market, by Material
Microfluidics Devices Market, by Application
9.2.1.2 Canada
Microfluidics Devices Market, by Industry
Microfluidics Devices Market, by Material
Microfluidics Devices Market, by Application
9.2.2 South America
Microfluidics Devices Market, by Industry
Microfluidics Devices Market, by Material
Microfluidics Devices Market, by Application
9.3 Europe
Microfluidics Devices Market, by Industry
Microfluidics Devices Market, by Material
Microfluidics Devices Market, by Application
9.3.1 Western Europe
Microfluidics Devices Market, by Industry
Microfluidics Devices Market, by Material
Microfluidics Devices Market, by Application
9.3.1.1 Germany
Microfluidics Devices Market, by Industry
Microfluidics Devices Market, by Material
Microfluidics Devices Market, by Application
9.3.1.2 France
Microfluidics Devices Market, by Industry
Microfluidics Devices Market, by Material
Microfluidics Devices Market, by Application
9.3.1.3 Italy
Microfluidics Devices Market, by Industry
Microfluidics Devices Market, by Material
Microfluidics Devices Market, by Application
9.3.1.4 Spain
Microfluidics Devices Market, by Industry
Microfluidics Devices Market, by Material
Microfluidics Devices Market, by Application
9.3.1.5 UK
Microfluidics Devices Market, by Industry
Microfluidics Devices Market, by Material
Microfluidics Devices Market, by Application
9.3.1.6 Rest of Western Europe
Microfluidics Devices Market, by Industry
Microfluidics Devices Market, by Material
Microfluidics Devices Market, by Application
9.3.2 Eastern Europe
Microfluidics Devices Market, by Industry
Microfluidics Devices Market, by Material
Microfluidics Devices Market, by Application
9.4 Asia-Pacific
Microfluidics Devices Market, by Industry
Microfluidics Devices Market, by Material
Microfluidics Devices Market, by Application
9.4.1 Japan
Microfluidics Devices Market, by Industry
Microfluidics Devices Market, by Material
Microfluidics Devices Market, by Application
9.4.2 China
Microfluidics Devices Market, by Industry
Microfluidics Devices Market, by Material
Microfluidics Devices Market, by Application
9.4.3 India
Microfluidics Devices Market, by Industry
Microfluidics Devices Market, by Material
Microfluidics Devices Market, by Application
9.4.4 Australia
Microfluidics Devices Market, by Industry
Microfluidics Devices Market, by Material
Microfluidics Devices Market, by Application
9.4.5 South Korea
Microfluidics Devices Market, by Industry
Microfluidics Devices Market, by Material
Microfluidics Devices Market, by Application
9.4.6 Rest of Asia-Pacific
Microfluidics Devices Market, by Industry
Microfluidics Devices Market, by Material
Microfluidics Devices Market, by Application
9.5 Middle East & Africa
Microfluidics Devices Market, by Industry
Microfluidics Devices Market, by Material
Microfluidics Devices Market, by Application
9.5.1 Middle East
Microfluidics Devices Market, by Industry
Microfluidics Devices Market, by Material
Microfluidics Devices Market, by Application
9.5.2 Africa
Microfluidics Devices Market, by Industry
Microfluidics Devices Market, by Material
Microfluidics Devices Market, by Application
10 Company Landscape
10.1 Introduction
10.2 Market Share Analysis
10.3 Key Development & Strategies
11 Company Profiles
11.1 Abbott Laboratories
11.1.1 Company Overview
11.1.2 Product Overview
11.1.3 Financials Overview
11.1.4 Key Developments
11.1.5 SWOT Analysis
11.2 F. HOFFMANN-LA ROCHE AG
11.2.1 Company Overview
11.2.2 Product Overview
11.2.3 Financial Overview
11.2.4 Key Developments
11.2.5 SWOT Analysis
11.3 Agilent Technologies, Inc.
11.3.1 Company Overview
11.3.2 Product Overview
11.3.3 Financial Overview
11.3.4 Key Development
11.3.5 SWOT Analysis
11.4 Siemens
11.4.1 Company Overview
11.4.2 Product Overview
11.4.3 Financial Overview
11.4.4 Key Development
11.4.5 SWOT Analysis
11.5 Fluidigm
11.5.1 Company Overview
11.5.2 Product Overview
11.5.3 Financial overview
11.5.4 Key Developments
11.5.5 SWOT Analysis
11.6 BIO-RAD LABORATORIES, INC.
11.6.1 Company Overview
11.6.2 Product Overview
11.6.3 Financial Overview
11.6.4 Key Developments
11.6.5 SWOT Analysis
11.7 CEPHEID
11.7.1 Overview
11.7.2 Product Overview
11.7.3 Financials
11.7.4 Key Developments
11.7.5 SWOT Analysis
11.8 RainDance Technologies, Inc.
11.8.1 Overview
11.8.2 Product Overview
11.8.3 Financials
11.8.4 Key Developments
11.8.5 SWOT Analysis
11.9 Dolomite Microfluidics
11.9.1 Overview
11.9.2 Product Overview
11.9.3 Financials
11.9.4 Key Developments
11.9.5 SWOT Analysis
11.10 Micronit Microtechnologies
11.10.1 Overview
11.10.2 Product Overview
11.10.3 Financials
11.10.4 Key Developments
11.10.5 SWOT Analysis
11.11 Johnson & Johnson Services, Inc.
11.11.1 Overview
11.11.2 Product Overview
11.11.3 Financials
11.11.4 Key Developments
11.11.5 SWOT Analysis
11.12 BD
11.12.1 Overview
11.12.2 Product Overview
11.12.3 Financials
11.12.4 Key Developments
11.12.5 SWOT Analysis
11.13 Elveflow
11.13.1 Overview
11.13.2 Product Overview
11.13.3 Financials
11.13.4 Key Developments
11.13.5 SWOT Analysis
11.14 Perkinelmer Inc.
11.14.1 Overview
11.14.2 Product Overview
11.14.3 Financials
11.14.4 Key Developments
11.14.5 SWOT Analysis
11.15 Thermo Fisher Scientific Inc.
11.15.1 Overview
11.15.2 Product Overview
11.15.3 Financials
11.15.4 Key Developments
11.15.5 SWOT Analysis
11.16 BioMérieux
11.16.1 Overview
11.16.2 Product Overview
11.16.3 Financials
11.16.4 Key Developments
11.16.5 SWOT Analysis
11.17 Others
12 MRFR Conclusion
12.1 Key Findings
12.1.1 From CEO’s Viewpoint
12.1.2 Unmet Needs of the Market
12.2 Key Companies to Watch
12.3 Predictions for the global microfluidics devices market
13 Appendix
14 List of Tables
Table 1 Microfluidics Devices Market Synopsis, 2020–2027
Table 2 Microfluidics Devices Market Estimates and Forecast, 2020–2027 (USD Million)
Table 3 Global Microfluidics Devices Market, by Region, 2020–2027 (USD Million)
Table 4 Global Microfluidics Devices Market, by Industry, 2020–2027 (USD Million)
Table 5 Global Microfluidics Devices Market, by Material, 2020–2027 (USD Million)
Table 6 Global Microfluidics Devices Market, by Application, 2020–2027 (USD Million)
Table 7 North America: Microfluidics Devices Market, by Industry, 2020–2027 (USD Million)
Table 8 North America: Microfluidics Devices Market, by Material, 2020–2027 (USD Million)
Table 9 North America: Microfluidics Devices Market, by Application, 2020–2027 (USD Million)
Table 10 US: Microfluidics Devices Market, by Industry, 2020–2027 (USD Million)
Table 11 US: Microfluidics Devices Market, by Material, 2020–2027 (USD Million)
Table 12 US: Microfluidics Devices Market, by Application, 2020–2027 (USD Million)
Table 13 Canada: Microfluidics Devices Market, by Industry, 2020–2027 (USD Million)
Table 14 Canada: Microfluidics Devices Market, by Material, 2020–2027 (USD Million)
Table 15 Canada: Microfluidics Devices Market, by Application, 2020–2027 (USD Million)
Table 16 South America: Microfluidics Devices Market, by Industry, 2020–2027 (USD Million)
Table 17 South America: Microfluidics Devices Market, by Material, 2020–2027 (USD Million)
Table 18 South America: Microfluidics Devices Market, by Application, 2020–2027 (USD Million)
Table 19 Europe: Microfluidics Devices Market, by Industry, 2020–2027 (USD Million)
Table 20 Europe: Microfluidics Devices Market, by Material, 2020–2027 (USD Million)
Table 21 Europe: Microfluidics Devices Market, by Application, 2020–2027 (USD Million)
Table 22 Western Europe: Microfluidics Devices Market, by Industry, 2020–2027 (USD Million)
Table 23 Western Europe: Microfluidics Devices Market, by Material, 2020–2027 (USD Million)
Table 24 Western Europe: Microfluidics Devices Market, by Application, 2020–2027 (USD Million)
Table 25 Eastern Europe: Microfluidics Devices Market, by Industry, 2020–2027 (USD Million)
Table 26 Eastern Europe: Microfluidics Devices Market, by Material, 2020–2027 (USD Million)
Table 27 Eastern Europe: Microfluidics Devices Market, by Application, 2020–2027 (USD Million)
Table 28 Asia-Pacific: Microfluidics Devices Market, by Industry, 2020–2027 (USD Million)
Table 29 Asia-Pacific: Microfluidics Devices Market, by Material, 2020–2027 (USD Million)
Table 30 Asia-Pacific: Microfluidics Devices Market, by Application, 2020–2027 (USD Million)
Table 31 Middle East & Africa: Microfluidics Devices Market, by Industry, 2020–2027 (USD Million)
Table 32 Middle East & Africa: Microfluidics Devices Market, by Material, 2020–2027 (USD Million)
Table 33 Middle East & Africa: Microfluidics Devices Market, by Application, 2020–2027 (USD Million)
15 List of Figures
Figure 1 Research Process
Figure 2 Segmentation for Global Microfluidics Devices Market
Figure 3 Market Dynamics for Global Microfluidics Devices Market
Figure 4 Microfluidics Devices Market Share, by Industry, 2020
Figure 5 Microfluidics Devices Market Share, by Material, 2020
Figure 6 Microfluidics Devices Market Share, by Application, 2020
Figure 7 Microfluidics Devices Market Share, by Region, 2020
Figure 8 North America: Microfluidics Devices Market Share, by Country, 2020
Figure 9 Europe: Microfluidics Devices Market Share, by Country, 2020
Figure 10 Asia-Pacific: Microfluidics Devices Market Share, by Country, 2020
Figure 11 Middle East & Africa: Microfluidics Devices Market Share, by Region, 2020
Figure 12 Microfluidics Devices Market: Company Share Analysis, 2020 (%)
Figure 12 Abbott Laboratories: Key Financials
Figure 13 Abbott Laboratories: Segmental Revenue
Figure 14 Abbott Laboratories: Geographical Revenue
Figure 15 F. HOFFMANN-LA ROCHE AG: Key Financials
Figure 16 F. HOFFMANN-LA ROCHE AG: Segmental Revenue
Figure 17 F. HOFFMANN-LA ROCHE AG: Geographical Revenue
Figure 18 Agilent Technologies, Inc.: Key Financials
Figure 19 Agilent Technologies, Inc.: Segmental Revenue
Figure 20 Agilent Technologies, Inc.: Geographical Revenue
Figure 21 Siemens: Key Financials
Figure 22 Siemens: Segmental Revenue
Figure 23 Siemens: Geographical Revenue
Figure 24 Fluidigm: Key Financials
Figure 25 Fluidigm: Segmental Revenue
Figure 26 Fluidigm: Geographical Revenue
Figure 27 BIO-RAD LABORATORIES, INC.: Key Financials
Figure 28 BIO-RAD LABORATORIES, INC.: Segmental Revenue
Figure 29 BIO-RAD LABORATORIES, INC.: Geographical Revenue
Figure 30 RainDance Technologies, Inc.: Key Financials
Figure 31 RainDance Technologies, Inc.: Segmental Revenue
Figure 32 RainDance Technologies, Inc.: Geographical Revenue
Figure 33 Dolomite Microfluidics: Key Financials
Figure 34 Dolomite Microfluidics: Segmental Revenue
Figure 35 Dolomite Microfluidics: Geographical Revenue
Figure 36 Micronit Microtechnologies: Key Financials
Figure 37 Micronit Microtechnologies: Segmental Revenue
Figure 38 Micronit Microtechnologies: Geographical Revenue
Figure 39 CEPHEID: Key Financials
Figure 40 CEPHEID: Segmental Revenue
Figure 41 CEPHEID: Geographical Revenue
Figure 42 BD: Key Financials
Figure 43 BD: Segmental Revenue
Figure 44 BD: Geographical Revenue
Figure 45 Elveflow: Key Financials
Figure 46 Elveflow: Segmental Revenue
Figure 47 Elveflow: Geographical Revenue
Figure 48 Perkinelmer Inc.: Key Financials
Figure 49 Perkinelmer Inc.: Segmental Revenue
Figure 50 Perkinelmer Inc.: Geographical Revenue
Figure 51 Thermo Fisher Scientific Inc.: Key Financials
Figure 52 Thermo Fisher Scientific Inc.: Segmental Revenue
Figure 53 Thermo Fisher Scientific Inc.: Geographical Revenue
Figure 54 BioMérieux: Key Financials
Figure 55 BioMérieux: Segmental Revenue
Figure 56 BioMérieux: Geographical Revenue