Request Free Sample ×

Kindly complete the form below to receive a free sample of this Report

* Please use a valid business email

Leading companies partner with us for data-driven Insights

clients tt-cursor
Hero Background

Mexico Portable Gas Detector Market

ID: MRFR/Equip/63812-CR
107 Pages
Pradeep Nandi
Last Updated: January 13, 2026

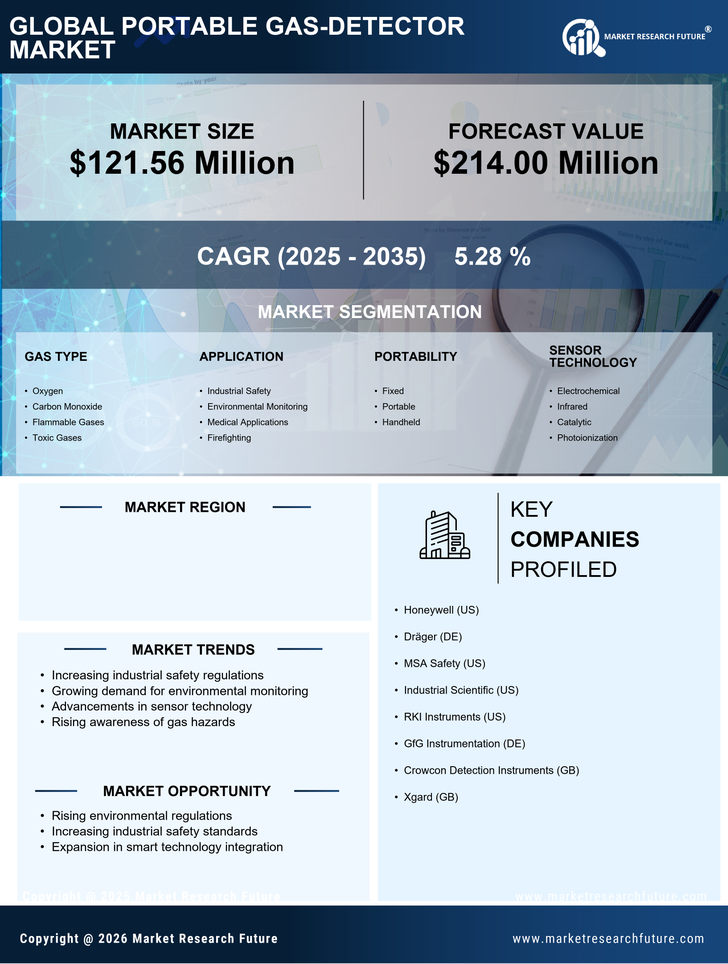
Mexico Portable Gas Detector Market Research Report Information by Product Type (Single-Gas Detectors, Multi-Gas Detectors), by Sensor Type (Electrochemical Sensors, Infrared (IR) Sensors, Semiconductor Sensors, Catalytic Sensors, Photoionization Detectors (PID)), by Gas Type (Combustible Gases, Toxic Gases, Oxygen Deficiency Detectors, Volatile Organic Compounds (VOCs)), by End-Use Industry (Oil & Gas, Mining, Industrial Manufacturing, Fire Safety & Emergency Services, Chemicals & Petrochemicals, Construction, Food & Beverages, Pharmaceuticals, Utilities & Power Plants, Others), by Power Source (Battery-Operated Detectors, Rechargeable Detectors), by Distribution Channel (Direct Sales, Distributors & Dealers, Online Sales) and Country (Mexico) - Forecast till 2035

Share:
Download PDF ×

We do not share your information with anyone. However, we may send you emails based on your report interest from time to time. You may contact us at any time to opt-out.

Mexico Portable Gas Detector Market Infographic
Purchase Options
  1. 1 SECTION I: EXECUTIVE SUMMARY AND KEY HIGHLIGHTS
  2.   1.1 EXECUTIVE SUMMARY
  3.     1.1.1 Market Overview
  4.     1.1.2 Key Findings
  5.     1.1.3 Market Segmentation
  6.     1.1.4 Competitive Landscape
  7.     1.1.5 Challenges and Opportunities
  8.     1.1.6 Future Outlook
  9. 2 SECTION II: SCOPING, METHODOLOGY AND MARKET STRUCTURE
  10.   2.1 MARKET INTRODUCTION
  11.     2.1.1 Definition
  12.     2.1.2 Scope of the study
  13.       2.1.2.1 Research Objective
  14.       2.1.2.2 Assumption
  15.       2.1.2.3 Limitations
  16.   2.2 RESEARCH METHODOLOGY
  17.     2.2.1 Overview
  18.     2.2.2 Data Mining
  19.     2.2.3 Secondary Research
  20.     2.2.4 Primary Research
  21.       2.2.4.1 Primary Interviews and Information Gathering Process
  22.       2.2.4.2 Breakdown of Primary Respondents
  23.     2.2.5 Forecasting Model
  24.     2.2.6 Market Size Estimation
  25.       2.2.6.1 Bottom-Up Approach
  26.       2.2.6.2 Top-Down Approach
  27.     2.2.7 Data Triangulation
  28.     2.2.8 Validation
  29. 3 SECTION III: QUALITATIVE ANALYSIS
  30.   3.1 MARKET DYNAMICS
  31.     3.1.1 Overview
  32.     3.1.2 Drivers
  33.     3.1.3 Restraints
  34.     3.1.4 Opportunities
  35.   3.2 MARKET FACTOR ANALYSIS
  36.     3.2.1 Value chain Analysis
  37.     3.2.2 Porter's Five Forces Analysis
  38.       3.2.2.1 Bargaining Power of Suppliers
  39.       3.2.2.2 Bargaining Power of Buyers
  40.       3.2.2.3 Threat of New Entrants
  41.       3.2.2.4 Threat of Substitutes
  42.       3.2.2.5 Intensity of Rivalry
  43.     3.2.3 COVID-19 Impact Analysis
  44.       3.2.3.1 Market Impact Analysis
  45.       3.2.3.2 Regional Impact
  46.       3.2.3.3 Opportunity and Threat Analysis
  47. 4 SECTION IV: QUANTITATIVE ANALYSIS
  48.   4.1 Food, Beverages & Nutrition, BY Gas Type (USD Million)
  49.     4.1.1 Oxygen
  50.     4.1.2 Carbon Monoxide
  51.     4.1.3 Flammable Gases
  52.     4.1.4 Toxic Gases
  53.   4.2 Food, Beverages & Nutrition, BY Application (USD Million)
  54.     4.2.1 Industrial Safety
  55.     4.2.2 Environmental Monitoring
  56.     4.2.3 Medical Applications
  57.     4.2.4 Firefighting
  58.   4.3 Food, Beverages & Nutrition, BY Portability (USD Million)
  59.     4.3.1 Fixed
  60.     4.3.2 Portable
  61.     4.3.3 Handheld
  62.   4.4 Food, Beverages & Nutrition, BY Sensor Technology (USD Million)
  63.     4.4.1 Electrochemical
  64.     4.4.2 Infrared
  65.     4.4.3 Catalytic
  66.     4.4.4 Photoionization
  67.   4.5 Food, Beverages & Nutrition, BY End User (USD Million)
  68.     4.5.1 Oil and Gas Companies
  69.     4.5.2 Chemical Companies
  70.     4.5.3 Manufacturing Plants
  71.     4.5.4 Fire Departments
  72. 5 SECTION V: COMPETITIVE ANALYSIS
  73.   5.1 Competitive Landscape
  74.     5.1.1 Overview
  75.     5.1.2 Competitive Analysis
  76.     5.1.3 Market share Analysis
  77.     5.1.4 Major Growth Strategy in the Food, Beverages & Nutrition
  78.     5.1.5 Competitive Benchmarking
  79.     5.1.6 Leading Players in Terms of Number of Developments in the Food, Beverages & Nutrition
  80.     5.1.7 Key developments and growth strategies
  81.       5.1.7.1 New Product Launch/Service Deployment
  82.       5.1.7.2 Merger & Acquisitions
  83.       5.1.7.3 Joint Ventures
  84.     5.1.8 Major Players Financial Matrix
  85.       5.1.8.1 Sales and Operating Income
  86.       5.1.8.2 Major Players R&D Expenditure. 2023
  87.   5.2 Company Profiles
  88.     5.2.1 Honeywell (US)
  89.       5.2.1.1 Financial Overview
  90.       5.2.1.2 Products Offered
  91.       5.2.1.3 Key Developments
  92.       5.2.1.4 SWOT Analysis
  93.       5.2.1.5 Key Strategies
  94.     5.2.2 Dräger (DE)
  95.       5.2.2.1 Financial Overview
  96.       5.2.2.2 Products Offered
  97.       5.2.2.3 Key Developments
  98.       5.2.2.4 SWOT Analysis
  99.       5.2.2.5 Key Strategies
  100.     5.2.3 MSA Safety (US)
  101.       5.2.3.1 Financial Overview
  102.       5.2.3.2 Products Offered
  103.       5.2.3.3 Key Developments
  104.       5.2.3.4 SWOT Analysis
  105.       5.2.3.5 Key Strategies
  106.     5.2.4 Industrial Scientific (US)
  107.       5.2.4.1 Financial Overview
  108.       5.2.4.2 Products Offered
  109.       5.2.4.3 Key Developments
  110.       5.2.4.4 SWOT Analysis
  111.       5.2.4.5 Key Strategies
  112.     5.2.5 RKI Instruments (US)
  113.       5.2.5.1 Financial Overview
  114.       5.2.5.2 Products Offered
  115.       5.2.5.3 Key Developments
  116.       5.2.5.4 SWOT Analysis
  117.       5.2.5.5 Key Strategies
  118.     5.2.6 GfG Instrumentation (DE)
  119.       5.2.6.1 Financial Overview
  120.       5.2.6.2 Products Offered
  121.       5.2.6.3 Key Developments
  122.       5.2.6.4 SWOT Analysis
  123.       5.2.6.5 Key Strategies
  124.     5.2.7 Crowcon Detection Instruments (GB)
  125.       5.2.7.1 Financial Overview
  126.       5.2.7.2 Products Offered
  127.       5.2.7.3 Key Developments
  128.       5.2.7.4 SWOT Analysis
  129.       5.2.7.5 Key Strategies
  130.     5.2.8 Xgard (GB)
  131.       5.2.8.1 Financial Overview
  132.       5.2.8.2 Products Offered
  133.       5.2.8.3 Key Developments
  134.       5.2.8.4 SWOT Analysis
  135.       5.2.8.5 Key Strategies
  136.   5.3 Appendix
  137.     5.3.1 References
  138.     5.3.2 Related Reports
  139. 6 LIST OF FIGURES
  140.   6.1 MARKET SYNOPSIS
  141.   6.2 MEXICO MARKET ANALYSIS BY GAS TYPE
  142.   6.3 MEXICO MARKET ANALYSIS BY APPLICATION
  143.   6.4 MEXICO MARKET ANALYSIS BY PORTABILITY
  144.   6.5 MEXICO MARKET ANALYSIS BY SENSOR TECHNOLOGY
  145.   6.6 MEXICO MARKET ANALYSIS BY END USER
  146.   6.7 KEY BUYING CRITERIA OF FOOD, BEVERAGES & NUTRITION
  147.   6.8 RESEARCH PROCESS OF MRFR
  148.   6.9 DRO ANALYSIS OF FOOD, BEVERAGES & NUTRITION
  149.   6.10 DRIVERS IMPACT ANALYSIS: FOOD, BEVERAGES & NUTRITION
  150.   6.11 RESTRAINTS IMPACT ANALYSIS: FOOD, BEVERAGES & NUTRITION
  151.   6.12 SUPPLY / VALUE CHAIN: FOOD, BEVERAGES & NUTRITION
  152.   6.13 FOOD, BEVERAGES & NUTRITION, BY GAS TYPE, 2024 (% SHARE)
  153.   6.14 FOOD, BEVERAGES & NUTRITION, BY GAS TYPE, 2024 TO 2035 (USD Million)
  154.   6.15 FOOD, BEVERAGES & NUTRITION, BY APPLICATION, 2024 (% SHARE)
  155.   6.16 FOOD, BEVERAGES & NUTRITION, BY APPLICATION, 2024 TO 2035 (USD Million)
  156.   6.17 FOOD, BEVERAGES & NUTRITION, BY PORTABILITY, 2024 (% SHARE)
  157.   6.18 FOOD, BEVERAGES & NUTRITION, BY PORTABILITY, 2024 TO 2035 (USD Million)
  158.   6.19 FOOD, BEVERAGES & NUTRITION, BY SENSOR TECHNOLOGY, 2024 (% SHARE)
  159.   6.20 FOOD, BEVERAGES & NUTRITION, BY SENSOR TECHNOLOGY, 2024 TO 2035 (USD Million)
  160.   6.21 FOOD, BEVERAGES & NUTRITION, BY END USER, 2024 (% SHARE)
  161.   6.22 FOOD, BEVERAGES & NUTRITION, BY END USER, 2024 TO 2035 (USD Million)
  162.   6.23 BENCHMARKING OF MAJOR COMPETITORS
  163. 7 LIST OF TABLES
  164.   7.1 LIST OF ASSUMPTIONS
  165.     7.1.1
  166.   7.2 Mexico MARKET SIZE ESTIMATES; FORECAST
  167.     7.2.1 BY GAS TYPE, 2025-2035 (USD Million)
  168.     7.2.2 BY APPLICATION, 2025-2035 (USD Million)
  169.     7.2.3 BY PORTABILITY, 2025-2035 (USD Million)
  170.     7.2.4 BY SENSOR TECHNOLOGY, 2025-2035 (USD Million)
  171.     7.2.5 BY END USER, 2025-2035 (USD Million)
  172.   7.3 PRODUCT LAUNCH/PRODUCT DEVELOPMENT/APPROVAL
  173.     7.3.1
  174.   7.4 ACQUISITION/PARTNERSHIP
  175.     7.4.1

Mexico Food, Beverages & Nutrition Market Segmentation

Food, Beverages & Nutrition By Gas Type (USD Million, 2025-2035)

  • Oxygen
  • Carbon Monoxide
  • Flammable Gases
  • Toxic Gases

Food, Beverages & Nutrition By Application (USD Million, 2025-2035)

  • Industrial Safety
  • Environmental Monitoring
  • Medical Applications
  • Firefighting

Food, Beverages & Nutrition By Portability (USD Million, 2025-2035)

  • Fixed
  • Portable
  • Handheld

Food, Beverages & Nutrition By Sensor Technology (USD Million, 2025-2035)

  • Electrochemical
  • Infrared
  • Catalytic
  • Photoionization

Food, Beverages & Nutrition By End User (USD Million, 2025-2035)

  • Oil and Gas Companies
  • Chemical Companies
  • Manufacturing Plants
  • Fire Departments

Compare Licence

×
Features License Type
Single User Multiuser License Enterprise User
Price $4,950 $5,950 $7,250
Maximum User Access Limit 1 User Upto 10 Users Unrestricted Access Throughout the Organization
Free Customization
Direct Access to Analyst
Deliverable Format
Platform Access
Discount on Next Purchase 10% 15% 15%
Printable Versions