Methionine Market (2026 - 2035)

ID: MRFR/FnB/4343-HCR
100 Pages
Snehal Singh
Last Updated: July 10, 2026
Methionine Market Size, Share, Industry Trend & Analysis Research Report Information By Type (Powder, Liquid), By Grade (Feed Grade, Food & Beverage Grade, Pharmaceutical Grade), By Production Technology (Petrochemical-Based Synthesis, Bio-Based Fermentation), By End-User Industry (Animal Feed, Food & Beverage, Pharmaceuticals), By Geography (Asia-Pacific, North America, Europe, South America, Middle East & Africa) – Forecast Till 2035
Methionine Market
Market Size
Forecast Period2026-2035
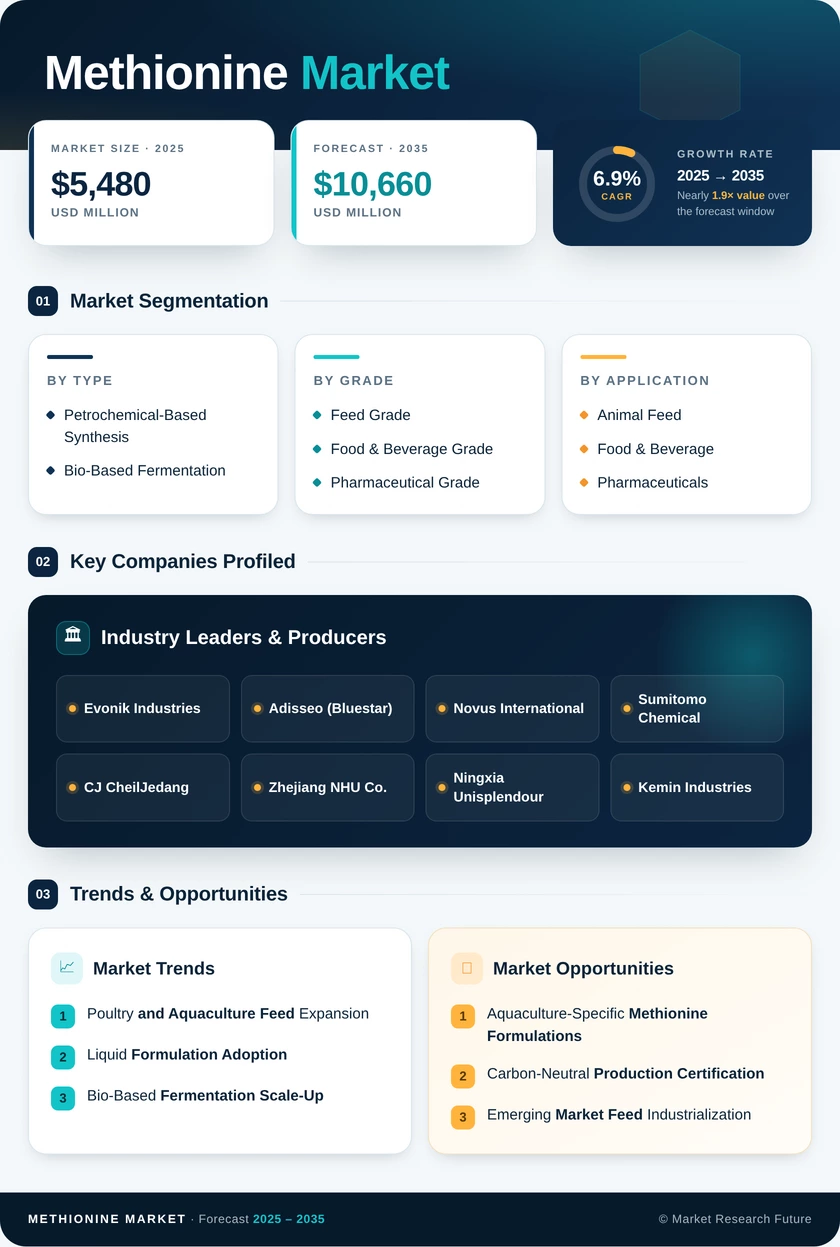
CAGR (2026-2035)6.9%
2025 Market SizeUSD 5,480 Million
2035 Market SizeUSD 10,660 Million
Key Players
Evonik Industries
Adisseo
Novus International
Sumitomo Chemical
CJ CheilJedang
Zhejiang NHU Co.
Opportunities
  • Aquaculture-Specific Methionine Formulations
  • Carbon-Neutral Production Certification
  • Emerging Market Feed Industrialization
  1. 1 Market Overview |
    1. 1.1 Study Assumptions & Market Definition |
    2. 1.2 Scope of the Study |
    3. 1.3 Research Methodology
  2. 2 Market Summary & Key Takeaways
  3. 3 Market Dynamics |
    1. 3.1 Market Drivers Analysis | |
      1. 3.1.1 Poultry & Aquaculture Feed Expansion | |
      2. 3.1.2 Liquid Formulation Adoption in Automated Mills | |
      3. 3.1.3 Bio-Based Fermentation Scale-Up | |
      4. 3.1.4 Pharmaceutical & Nutraceutical Demand Growth | |
      5. 3.1.5 Precision Livestock Nutrition Digitization | |
      6. 3.1.6 Regulatory Tightening on Antibiotic Alternatives | |
      7. 3.1.7 Green-Hydrogen Process Integration |
    2. 3.2 Market Restraints Analysis | |
      1. 3.2.1 Feedstock Price Volatility (Propylene, Acrolein) | |
      2. 3.2.2 China Overcapacity and Margin Compression | |
      3. 3.2.3 Functional Amino Acid Substitution | |
      4. 3.2.4 Stringent Environmental Compliance Costs | |
      5. 3.2.5 Currency Fluctuation in Emerging Markets |
    3. 3.3 Market Opportunity Analysis | |
      1. 3.3.1 Aquaculture-Specific Methionine Formulations | |
      2. 3.3.2 Carbon-Neutral Production Certification | |
      3. 3.3.3 Emerging Market Feed Industrialization | |
      4. 3.3.4 Precision Nutrition and Digital Dosing Platforms | |
      5. 3.3.5 Pharmaceutical-Grade Expansion into Parenteral Nutrition |
    4. 3.4 Industry Value Chain Analysis |
    5. 3.5 Porter's Five Forces Analysis
  4. 4 Global Methionine Market Size & Forecast (2021–2035) |
    1. 4.1 Historical Market Size (2021–2025) |
    2. 4.2 Current & Forecast Market Size (2026–2035) |
    3. 4.3 Market Size by Revenue (USD Million) |
    4. 4.4 Year-over-Year Growth Analysis
  5. 5 Segmentation Analysis |
    1. 5.1 By Type | |
      1. 5.1.1 Powder | |
      2. 5.1.2 Liquid |
    2. 5.2 By Grade | |
      1. 5.2.1 Feed Grade | |
      2. 5.2.2 Food & Beverage Grade | |
      3. 5.2.3 Pharmaceutical Grade |
    3. 5.3 By Production Technology | |
      1. 5.3.1 Petrochemical-Based Synthesis | |
      2. 5.3.2 Bio-Based Fermentation |
    4. 5.4 By End-User Industry | |
      1. 5.4.1 Animal Feed | |
      2. 5.4.2 Food & Beverage | |
      3. 5.4.3 Pharmaceuticals
  6. 6 Regional Analysis |
    1. 6.1 North America | |
      1. 6.1.1 United States | |
      2. 6.1.2 Canada | |
      3. 6.1.3 Mexico |
    2. 6.2 Europe | |
      1. 6.2.1 Germany | |
      2. 6.2.2 United Kingdom | |
      3. 6.2.3 France | |
      4. 6.2.4 Italy | |
      5. 6.2.5 Spain | |
      6. 6.2.6 Nordic Countries | |
      7. 6.2.7 Russia | |
      8. 6.2.8 Rest of Europe |
    3. 6.3 Asia-Pacific | |
      1. 6.3.1 China | |
      2. 6.3.2 India | |
      3. 6.3.3 Japan | |
      4. 6.3.4 South Korea | |
      5. 6.3.5 ASEAN | |
      6. 6.3.6 Rest of Asia-Pacific |
    4. 6.4 South America | |
      1. 6.4.1 Brazil | |
      2. 6.4.2 Argentina | |
      3. 6.4.3 Rest of South America |
    5. 6.5 Middle East & Africa | |
      1. 6.5.1 Saudi Arabia | |
      2. 6.5.2 UAE | |
      3. 6.5.3 South Africa | |
      4. 6.5.4 Egypt | |
      5. 6.5.5 Rest of MEA
  7. 7 Competitive Landscape |
    1. 7.1 Market Share Analysis (2025) |
    2. 7.2 Competitive Benchmarking Matrix |
    3. 7.3 Company Profiles | |
      1. 7.3.1 Evonik Industries | |
      2. 7.3.2 Adisseo (Bluestar) | |
      3. 7.3.3 Novus International | |
      4. 7.3.4 Sumitomo Chemical | |
      5. 7.3.5 CJ CheilJedang | |
      6. 7.3.6 Zhejiang NHU Co. | |
      7. 7.3.7 Ningxia Unisplendour | |
      8. 7.3.8 Kemin Industries | |
      9. 7.3.9 Metabolic Explorer (METEX) | |
      10. 7.3.10 Archer Daniels Midland
  8. 8 Future Outlook & Strategic Recommendations (2026–2035) |
    1. 8.1 Bio-Fermentation at Commercial Scale |
    2. 8.2 Precision Animal Nutrition and AI Integration |
    3. 8.3 ESG Reporting and Supply-Chain Transparency |
    4. 8.4 Consolidation and Vertical Integration
  9. 9 Recent Developments & News
  10. 10 Frequently Asked Questions (FAQs)
  11. 11 Report Scope & Methodology |
    1. 11.1 Study Period & Base Year |
    2. 11.2 Data Sources & Citations |
    3. 11.3 Abbreviations
  12. 12 LIST OF TABLES |
  13. TABLE 1 Global Methionine Market Size & Forecast, by Revenue (USD Million), 2021–2035 |
  14. TABLE 2 Global Methionine Market – Year-over-Year Growth Analysis, 2021–2035 |
  15. TABLE 3 Global Methionine Market – Driver Impact Analysis |
  16. TABLE 4 Global Methionine Market – Restraint Impact Analysis |
  17. TABLE 5 Global Methionine Market Size, by Type, 2021–2035 (USD Million) |
  18. TABLE 6 Global Methionine Market Size, by Grade, 2021–2035 (USD Million) |
  19. TABLE 7 Global Methionine Market Size, by Production Technology, 2021–2035 (USD Million) |
  20. TABLE 8 Global Methionine Market Size, by End-User Industry, 2021–2035 (USD Million) |
  21. TABLE 9 Global Methionine Market Size, by Region, 2021–2035 (USD Million) |
  22. TABLE 10 North America Methionine Market Size, by Country, 2021–2035 (USD Million) |
  23. TABLE 11 Europe Methionine Market Size, by Country, 2021–2035 (USD Million) |
  24. TABLE 12 Asia-Pacific Methionine Market Size, by Country, 2021–2035 (USD Million) |
  25. TABLE 13 South America Methionine Market Size, by Country, 2021–2035 (USD Million) |
  26. TABLE 14 Middle East & Africa Methionine Market Size, by Country, 2021–2035 (USD Million) |
  27. TABLE 15 Competitive Benchmarking Matrix – Global Methionine Market, 2025 |
  28. TABLE 16 Company Profiles – Key Players, Global Methionine Market |
  29. TABLE 17 Recent Developments & Strategic Announcements, 2023–2025 |
  30. TABLE 18 North America Methionine Market Size, by Type, 2021–2035 (USD Million) |
  31. TABLE 19 North America Methionine Market Size, by Grade, 2021–2035 (USD Million) |
  32. TABLE 20 North America Methionine Market Size, by Production Technology, 2021–2035 (USD Million) |
  33. TABLE 21 North America Methionine Market Size, by End-User Industry, 2021–2035 (USD Million) |
  34. TABLE 22 Europe Methionine Market Size, by Type, 2021–2035 (USD Million) |
  35. TABLE 23 Europe Methionine Market Size, by Grade, 2021–2035 (USD Million) |
  36. TABLE 24 Europe Methionine Market Size, by Production Technology, 2021–2035 (USD Million) |
  37. TABLE 25 Europe Methionine Market Size, by End-User Industry, 2021–2035 (USD Million) |
  38. TABLE 26 Asia-Pacific Methionine Market Size, by Type, 2021–2035 (USD Million) |
  39. TABLE 27 Asia-Pacific Methionine Market Size, by Grade, 2021–2035 (USD Million) |
  40. TABLE 28 Asia-Pacific Methionine Market Size, by Production Technology, 2021–2035 (USD Million) |
  41. TABLE 29 Asia-Pacific Methionine Market Size, by End-User Industry, 2021–2035 (USD Million) |
  42. TABLE 30 South America Methionine Market Size, by Type, 2021–2035 (USD Million) |
  43. TABLE 31 South America Methionine Market Size, by Grade, 2021–2035 (USD Million) |
  44. TABLE 32 South America Methionine Market Size, by Production Technology, 2021–2035 (USD Million) |
  45. TABLE 33 South America Methionine Market Size, by End-User Industry, 2021–2035 (USD Million) |
  46. TABLE 34 Middle East & Africa Methionine Market Size, by Type, 2021–2035 (USD Million) |
  47. TABLE 35 Middle East & Africa Methionine Market Size, by Grade, 2021–2035 (USD Million) |
  48. TABLE 36 Middle East & Africa Methionine Market Size, by Production Technology, 2021–2035 (USD Million) |
  49. TABLE 37 Middle East & Africa Methionine Market Size, by End-User Industry, 2021–2035 (USD Million) |
  50. TABLE 38 Report Scope and Methodology Summary |
  51. TABLE 39 Detailed Sources and Citations
  52. 13 LIST OF FIGURES |
  53. FIGURE 1 Global Methionine Market Dynamics (Drivers, Restraints, Opportunities) |
  54. FIGURE 2 Industry Value Chain Analysis – Methionine Market |
  55. FIGURE 3 Porter's Five Forces Analysis – Methionine Market |
  56. FIGURE 4 Global Methionine Market Size Trend (USD Million), 2021–2035 |
  57. FIGURE 5 Methionine Market Share, by Type, 2025 (%) |
  58. FIGURE 6 Methionine Market Share, by Grade, 2025 (%) |
  59. FIGURE 7 Methionine Market Share, by Production Technology, 2025 (%) |
  60. FIGURE 8 Methionine Market Share, by End-User Industry, 2025 (%) |
  61. FIGURE 9 Methionine Market Share, by Region, 2025 (%) |
  62. FIGURE 10 North America Methionine Market Share, by Country, 2025 (%) |
  63. FIGURE 11 Europe Methionine Market Share, by Country, 2025 (%) |
  64. FIGURE 12 Asia-Pacific Methionine Market Share, by Country, 2025 (%) |
  65. FIGURE 13 South America Methionine Market Share, by Country, 2025 (%) |
  66. FIGURE 14 Middle East & Africa Methionine Market Share, by Country, 2025 (%) |
  67. FIGURE 15 Competitive Landscape – Market Share Analysis, 2025 |
  68. FIGURE 16 Competitive Benchmarking Radar Chart – Top 10 Players

Segmentation Quick Reference

DimensionSub-SegmentsDominant Segment (2025)Fastest Growing Segment (2026–2035)
TypePowder, LiquidPowder (63.1% share)Liquid (8.9% CAGR)
GradeFeed Grade, Food & Beverage Grade, Pharmaceutical GradeFeed Grade (83.7% share)Pharmaceutical Grade (9.3% CAGR)
Production TechnologyPetrochemical-Based Synthesis, Bio-Based FermentationPetrochemical-Based Synthesis (79.3% share)Bio-Based Fermentation (9.7% CAGR)
End-User IndustryAnimal Feed, Food & Beverage, PharmaceuticalsAnimal Feed (90.1% share)Pharmaceuticals (9.8% CAGR)
GeographyAsia-Pacific, North America, Europe, South America, Middle East & AfricaAsia-Pacific (48.2% share)Asia-Pacific (8.1% CAGR)


Market Segmentation Overview

By Type

Sub-SegmentKey Trend
PowderRemains the standard form for bulk feed blending; price-competitive and widely available across all regions
LiquidGaining share in automated mills with precision dosing systems; lower dust and improved worker safety profiles


Powder methionine retains a commanding majority of global consumption, particularly in regions where manual and semi-automated feed mills predominate. Liquid formulations are carving out share in North America and Europe, where large-scale automated operations prioritize dosing accuracy, reduced waste, and occupational health compliance.

By Grade

Sub-SegmentKey Trend
Feed GradeAnchored by poultry, swine, and aquaculture nutrition; stable demand growth aligned with global protein consumption
Food & Beverage GradeEmerging applications in functional foods and amino acid-fortified beverages targeting health-conscious consumers
Pharmaceutical GradeFastest-growing grade segment driven by hepatoprotection therapies and parenteral nutrition clinical protocols


Feed-grade products form the volumetric backbone of the industry, but pharmaceutical-grade methionine commands the highest per-unit margins. Food and beverage grade occupies a niche but expanding role as consumers seek amino acid-enriched supplements and functional food products.

By Production Technology

Sub-SegmentKey Trend
Petrochemical-Based SynthesisMature technology with established cost curves; faces increasing carbon-compliance pressure under CBAM and CSRD
Bio-Based FermentationRapidly scaling from pilot to commercial capacity; offers significant lifecycle emissions reductions and ESG appeal


Petrochemical synthesis will continue to supply the majority of global methionine through 2030, but bio-based fermentation is on a trajectory to capture meaningful share as titers improve and renewable feedstock costs decline. The technology transition represents the most significant structural shift within the industry this decade.

By End-User Industry

Sub-SegmentKey Trend
Animal FeedDominant end-use with poultry as the largest sub-channel; aquaculture is the fastest-growing feed application
Food & BeverageSmall but growing, driven by amino acid supplementation trends in sports nutrition and functional foods
PharmaceuticalsHighest value-per-ton segment; clinical expansion in liver therapies and parenteral solutions drives premium demand


Animal feed will remain the primary demand engine, but the pharmaceutical segment offers disproportionate margin growth. Food and beverage applications, while still modest in volume, are benefiting from consumer wellness trends and clean-label ingredient sourcing.

By Geography

Sub-SegmentKey Trend
Asia-PacificLargest and fastest-growing region; China's capacity expansion and ASEAN poultry integration drive volume
North AmericaMature market with high per-capita feed-additive intensity; precision nutrition adoption leads globally
EuropeSustainability-driven market with strong R&D investment; CBAM reshapes competitive dynamics for imports
South AmericaExport-oriented broiler industry anchors demand; Brazil dominates regional consumption
Middle East & AfricaStructurally underserved; poultry self-sufficiency programs and emerging aquaculture create long-term upside


Asia-Pacific's dominance reflects the concentration of global poultry and aquaculture production in China, Vietnam, Indonesia, and Thailand. North America and Europe represent mature, high-value markets where growth is driven less by volume expansion and more by technology upgrading and sustainability-linked procurement preferences.


 

Download PDF ×

We do not share your information with anyone. However, we may send you emails based on your report interest from time to time. You may contact us at any time to opt-out.