


Market Share
Medical Marijuana Market Share Analysis
The Medical Marijuana Market is experiencing significant growth and constant direction changes as a result of the evolving attitudes about cannabis, the increasing legalization, and the growing recognition of the curative potential of the substance. Medical marijuana coming from the cannabis plant has become a very important participant of the healthcare industry. One notable tendency in the medical marijuana market is the growing number of medical applications for this product. In the beginning, medical marijuana has been used for pain treatment, and now it is also studied as a therapy for epilepsy, multiple sclerosis, and emesis, which is the consequence of chemotherapy administration. Such a broader perception and development of multiple uses give birth to new marketing dynamics which provide variety of treatment options for patients.
Furthermore, the segment of Medical Marijuana is also witnessing a trend of product differentiation. With the advancing research, more concern is shown to developing specific strains and blends targeted according to various disease conditions. The emergence of this trend indicates the development and availability of more specific and effective cannabis products that can be administered in various forms such as oils, tinctures, edibles and topical applications. The widening of product line allows patients to have selective options which work perfectly for their taste and conditions.
The market is also noticing a shift towards wider uses and legalization. There is an increasing number of countries and states that acknowledge the medical benefits of cannabis and make legal the use of the plant for therapeutic purposes. Such modifications of the regulatory system are not only increasing the market reach but are also helping in reducing the stigma about medical cannabis which urges more patients to evaluate its potential.
The relationship between cannabis producers, pharmaceutical entities and healthcare practitioners is involved greatly in driving the medical marijuana market. Through these partnerships, research initiatives, clinical trials, and standardized medical marijuana products are attainable. These partnerships are driving now the integration of medical marijuana into mainstream healthcare processes. Partnerships are creating an environment of collaboration with the main purpose―evidence-based medical cannabis solutions.
With the evolution of technology in the healthcare sector, the Medical Marijuana Market is changing into a field that uses digital platforms for education, patient consultations, and product information. Through digital platforms and mobile apps, patients can gain information on strains, dosage recommendations and possible interactions. Telemedicine is becoming a common method for medical marijuana evaluations in which patients can easily and confidentially discuss their treatments with health professionals.

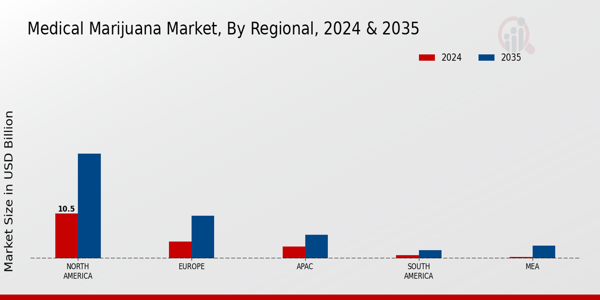 Source: Primary Research, Secondary Research, Market Research Future Database and Analyst Review


Leave a Comment