ID: MRFR/MED/0990-HCR | February 2021 | Region: Global | 80 pages
Market Scenario
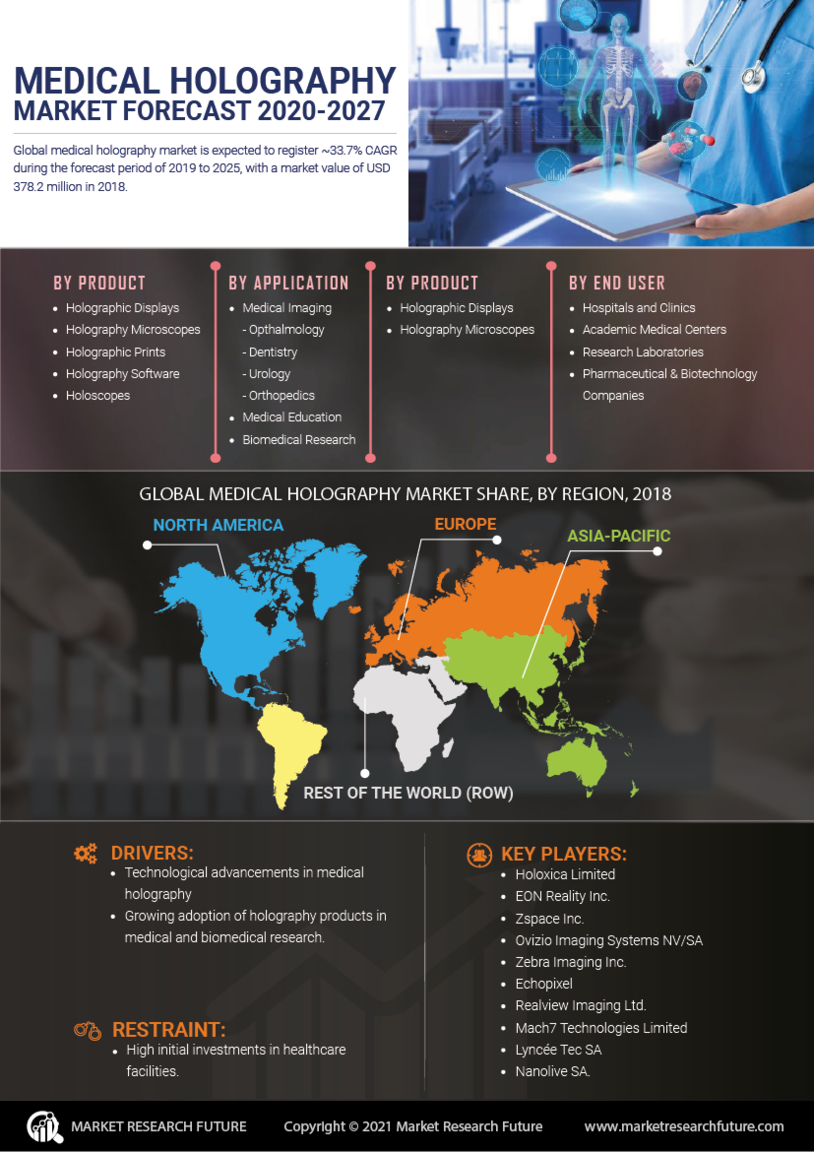
The global medical holography market is expected to register ~33.7% CAGR during the forecast period of 2019 to 2025, with a market value of USD 378.2 million in 2018.
Holography allows the user to view fully parallax and auto-stereoscopic 3D images. Within this
the research effort, static, full-color holograms were created depicting medical content.
The global medical holography market is driven by factors such as technological advancements in medical holography and the growing adoption of holography products in medical and biomedical research.
Additionally, holography is emerging as a promising technology for representing complex 3D structures in the medical field is anticipated to fuel market growth.
On the other hand, high initial investments in healthcare facilities to include holographic applications, are projected to hamper the growth of the market during the assessment period.
Moreover, major companies in the market are involved in strategic acquisitions, collaborations, and mergers to sustain their position in the market.
For instance, in April 2016, Mach7 Technologies and 3D Medical completed their merger. The combined company is working on developing advanced medical image management solutions to customers across five continents.
Segmentation
The global medical holography market has been segmented into product, application, end user, and region.
The global market, based on product, has been segmented into holographic displays, holography microscopes, holographic prints, holography software, and holoscopes. The global market, based on application, has been segmented into medical imaging (ophthalmology, dentistry, urology, orthopedics, and others), medical education, and biomedical research. The global market, based on end user, has been segmented into hospitals and clinics, academic medical centers, research laboratories, and pharmaceutical and biotechnology companies. Based on product, the holographic displays segment is expected to hold a major share of the market due to the rising adoption of holographic displays in diagnostic imaging and for medical education as these displays provide high-quality real-time 3D images, which attract the user effectively. Based on application, the medical imaging segment is anticipated to be the fastest-growing due to the increasing prevalence of chronic diseases where holography has wide range of applications in ophthalmology, dentistry, urology, and orthopedics.
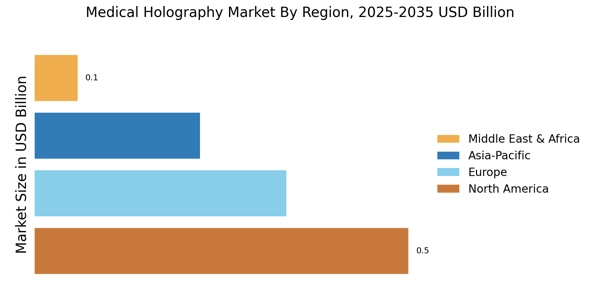
The market has been divided, by region, into the Americas, Europe, Asia-Pacific, and the Middle East & Africa. The medical holography market in the Americas has further been branched into North America and Latin America, with the North American market divided into the US and Canada. The European medical holography market has been sub-divided into Western Europe and Eastern Europe. Western Europe has further been classified as Germany, France, the UK, Italy, Spain, and the rest of Western Europe. The medical holography market in Asia-Pacific has been segmented into Japan, China, India, South Korea, Australia, and the rest of Asia-Pacific. The medical holography market in the Middle East & Africa has been divided into the Middle East and Africa.
Key Players
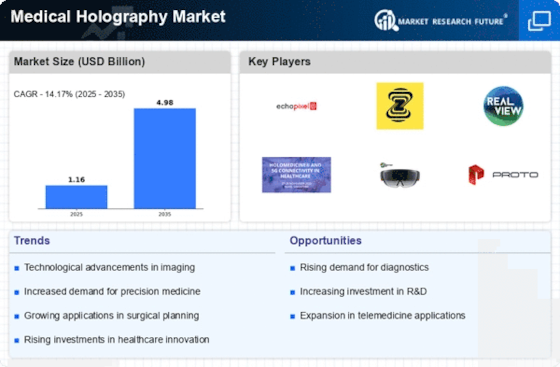
The key players operating in the global medical holography market are Holoxica Limited, EON Reality, Inc., Zspace, Inc., Ovizio Imaging Systems NV/SA, Zebra Imaging, Inc., Echopixel, Realview Imaging Ltd., Mach7 Technologies Limited, Lyncée Tec SA, and Nanolive SA.
Regional Market Summary
Global Medical Holography Market Share, by Region, 2018 (%)
Source: World Health Organization (WHO)
The market in the Americas is expected to dominate the global medical holography market due to the increasing per capita healthcare expenditure and the rising adoption of holography products in biomedical research and medical in the region. For example, in 2018, according to the Journal of the American Medical Association, the US performed 118 MRIs per 1,000 people. High adoption of holography in the US and Canada is expected to drive the market growth. Furthermore, the increasing expenses in research by healthcare bodies engaged in improving medical holography are the factors contributing to its largest share is expected to fuel the growth of the market in this region. The market in Europe showed a considerable amount of growth. This can be attributed to the presence of a well-established healthcare system, growing clinical applications of holography, and the involvement of key companies. For instance, in May 2016, Holoxica Limited launched the world’s first 3-D digital hologram image of the human brain fiber pathways. This new brain path imaging helps neurosurgeons and physicians to identify, diagnose, and treat a wide range of neurological conditions, such as motor neuron disease (MND), stroke, Alzheimer’s, and cancer. The market in Asia-Pacific is projected to have a steady growth rate during the forecast period owing to the growing use of holography products in medical facilities and increasing government initiatives for healthcare reforms. The market in the Middle East & Africa is expected to account for the least share of the global market due to the low per capita disposable income in the region.
Global Medical Holography Market, by Product
Frequently Asked Questions (FAQ) :
The global medical holography market is expected to register a whopping CAGR over 33.7% throughout the assessment period (2019-2025).
The global medical holography market had valued at USD 378.2 MN in 2018.
Growing adoption of holography products in medical and biomedical research.
North America holds the largest share in the global medical holography market followed by Europe and Asia Pacific, respectively.
EON Reality, Inc., Holoxica Limited, Zspace, Inc., Zebra Imaging, Inc., Ovizio Imaging Systems NV/SA Echopixel, Mach7 Technologies Limited, Realview Imaging Ltd., Nanolive SA, and Lyncée Tec SA, are some of the major players operating in the global medical holography market.
Table of Contents:
Chapter 1. Report Prologue
Chapter 2. Market Introduction
2.1 Definition
2.2 Scope of the Study
2.2.1 Research Objective
2.2.2 Assumptions
2.2.3 Limitations
Chapter 3. Research Methodology
3.1 Overview
3.2 Primary Research
3.3 Secondary Research
3.4 Market Size Estimation
Chapter 4. Market Dynamics
4.1 Drivers
4.2 Restraints
4.3 Opportunities
4.4 Challenges
Chapter 5. Market Factor Analysis
5.1 Porter’s Five Forces Analysis
5.1.1 Bargaining Power of Suppliers
5.1.2 Bargaining Power of Buyers
5.1.3 Threat of New Entrants
5.1.4 Threat of Substitutes
5.1.5 Intensity of Rivalry
5.2 Value Chain Analysis
Chapter 6. Global Medical Holography Market, by Product
6.1 Overview
6.2 Holographic Displays
Market Estimates & Forecast, by Region, 2019–2025
Market Estimates & Forecast, by Country, 2019–2025
6.3 Holography Microscopes
Market Estimates & Forecast, by Region, 2019–2025
Market Estimates & Forecast, by Country, 2019–2025
6.4 Holographic Prints
Market Estimates & Forecast, by Region, 2019–2025
Market Estimates & Forecast, by Country, 2019–2025
6.5 Holography Software
Market Estimates & Forecast, by Region, 2019–2025
Market Estimates & Forecast, by Country, 2019–2025
6.6 Holoscopes
Market Estimates & Forecast, by Region, 2019–2025
Market Estimates & Forecast, by Country, 2019–2025
Chapter 7. Global Medical Holography Market, by Application
7 .1 Overview
7 .2 Medical Imaging
Market Estimates & Forecast, by Region, 2019–2025
Market Estimates & Forecast, by Country, 2019–2025
7 .2.1 Opthalmology
Market Estimates & Forecast, by Region, 2019–2025
Market Estimates & Forecast, by Country, 2019–2025
7 .2.2 Dentistry
Market Estimates & Forecast, by Region, 2019–2025
Market Estimates & Forecast, by Country, 2019–2025
7 .2.3 Urology
Market Estimates & Forecast, by Region, 2019–2025
Market Estimates & Forecast, by Country, 2019–2025
7 .2.4 Orthopedics
Market Estimates & Forecast, by Region, 2019–2025
Market Estimates & Forecast, by Country, 2019–2025
7 .2.5 Others
Market Estimates & Forecast, by Region, 2019–2025
Market Estimates & Forecast, by Country, 2019–2025
7 .3 Medical Education
Market Estimates & Forecast, by Region, 2019–2025
Market Estimates & Forecast, by Country, 2019–2025
7 .4 Biomedical Research
Market Estimates & Forecast, by Region, 2019–2025
Market Estimates & Forecast, by Country, 2019–2025
Chapter 8. Global Medical Holography Market, by End User
8.1 Overview
8.2 Hospitals and Clinics
Market Estimates & Forecast, by Region, 2019–2025
Market Estimates & Forecast, by Country, 2019–2025
8.3 Academic Medical Centers
Market Estimates & Forecast, by Region, 2019–2025
Market Estimates & Forecast, by Country, 2019–2025
8.4 Research Laboratories
Market Estimates & Forecast, by Region, 2019–2025
Market Estimates & Forecast, by Country, 2019–2025
8.5 Pharmaceutical and Biotechnology Companies
Market Estimates & Forecast, by Region, 2019–2025
Market Estimates & Forecast, by Country, 2019–2025
Chapter 9. Global Medical Holography Market, by Region
9 .1 Overview
9 .2 Americas
9 .2.1 North America
9 .2.1.1 US
9 .2.1.2 Canada
9 .2.2 Latin America
9 .3 Europe
9 .3.1 Western Europe
9 .3.1.1 Germany
9 .3.1.2 France
9 .3.1.3 Italy
9 .3.1.4 Spain
9 .3.1.5 UK
9 .3.1.6 Rest of Western Europe
9 .3.2 Eastern Europe
9 .4 Asia-Pacific
9 .4.1 Japan
9 .4.2 China
9 .4.3 India
9 .4.4 Australia
9 .4.5 South Korea
9 .4.6 Rest of Asia-Pacific
9 .5 Middle East & Africa
9 .5.1 Middle East
9 .5.2 Africa
Chapter 10. Company Landscape
10.1 Overview
10.2 Competitive Analysis
Chapter 11. Company Profile
11.1 Holoxica Limited
11.1.1 Company Overview
11.1.2 Product Type Overview
11.1.3 Financial Overview Overview
11.1.4 Key Developments
11.1.5 SWOT Analysis
11.2 EON Reality, Inc.
11.2.1 Company Overview
11.2.2 Product Type Overview
11.2.3 Financial Overview
11.2.4 Key Developments
11.2.5 SWOT Analysis
11.3 Zspace, Inc.
11.3.1 Company Overview
11.3.2 Product Type Overview
11.3.3 Financial Overview
11.3.4 Key Development
11.3.5 SWOT Analysis
11.4 Ovizio Imaging Systems NV/SA
11.4.1 Company Overview
11.4.2 Product Type Overview
11.4.3 Financial Overview
11.4.4 Key Development
11.4.5 SWOT Analysis
11.5 Zebra Imaging, Inc.
11.5.1 Company Overview
11.5.2 Product Type Overview
11.5.3 Financial Overview
11.5.4 Key Developments
11.5.5 SWOT Analysis
11.6 Echopixel
11.6.1 Company Overview
11.6.2 Product Type Overview
11.6.3 Financial Overview
11.6.4 Key Developments
11.6.5 SWOT Analysis
11.7 Realview Imaging Ltd.
11.7 .1 Overview
11.7 .2 Product Type Overview
11.7 .3 Financial Overview
11.7 .4 Key Developments
11.7 .5 SWOT Analysis
11.8 Mach7 Technologies Limited
11.8.1 Overview
11.8.2 Product Type Overview
11.8.3 Financial Overview
11.8.4 Key Developments
11.8.5 SWOT Analysis
11.9 Lyncée Tec SA11.9.1 Overview
11.9.2 Product Type Overview
11.9.3 Financial Overview
11.9.4 Key Developments
11.9.5 SWOT Analysis
11.10 Nanolive SA
11.10.1 Overview
11.10.2 Product Type Overview
11.10.3 Financial Overview
11.10.4 Key Developments
11.10.5 SWOT Analysis
11.11 Others
Chapter 12 Appendix
12.1 References
12.2 Related Reports
LIST OF TABLES
Table 1 Global Medical Holography Market Synopsis, 2019–2025
Table 2 Global Medical Holography Market Estimates and Forecast, 2019–2025 (USD Million)
Table 3 Global Medical Holography Market, by Product, 2019–2025 (USD Million)
Table 4 Global Medical Holography Market, by Application, 2019–2025 (USD Million)
Table 5 Global Medical Holography Market, by End User, 2019–2025 (USD Million)
Table 6 Global Medical Holography Market, by Region, 2019–2025 (USD Million)
Table 7 North America: Medical Holography Market, by Product, 2019–2025 (USD Million)
Table 8 North America: Medical Holography Market, by Application, 2019–2025 (USD Million)
Table 9 North America: Medical Holography Market, by End User, 2019–2025 (USD Million)
Table 10 US: Medical Holography Market, by Product, 2019–2025 (USD Million)
Table 11 US: Medical Holography Market, by Application, 2019–2025 (USD Million)
Table 12 US: Medical Holography Market, by End User, 2019–2025 (USD Million)
Table 13 Canada: Medical Holography Market, by Product, 2019–2025 (USD Million)
Table 14 Canada: Medical Holography Market, by Application, 2019–2025 (USD Million)
Table 15 Canada: Medical Holography Market, by End User, 2019–2025 (USD Million)
Table 16 Latin America: Medical Holography Market, by Product, 2019–2025 (USD Million)
Table 17 Latin America: Medical Holography Market, by Application, 2019–2025 (USD Million)
Table 18 Latin America: Medical Holography Market, by End User, 2019–2025 (USD Million)
Table 19 Europe: Medical Holography Market, by Product, 2019–2025 (USD Million)
Table 20 Europe: Medical Holography Market, by Application, 2019–2025 (USD Million)
Table 21 Europe: Medical Holography Market, by End User, 2019–2025 (USD Million)
Table 22 Western Europe: Medical Holography Market, by Product, 2019–2025 (USD Million)
Table 23 Western Europe: Medical Holography Market, by Application, 2019–2025 (USD Million)
Table 24 Western Europe: Medical Holography Market, by End User, 2019–2025 (USD Million)
Table 25 Eastern Europe: Medical Holography Market, by Product, 2019–2025 (USD Million)
Table 26 Eastern Europe: Medical Holography Market, by Application, 2019–2025 (USD Million)
Table 27 Eastern Europe: Medical Holography Market, by End User, 2019–2025 (USD Million)
Table 28 Asia-Pacific: Medical Holography Market, by Product, 2019–2025 (USD Million)
Table 29 Asia-Pacific: Medical Holography Market, by Application, 2019–2025 (USD Million)
Table 30 Asia-Pacific: Medical Holography Market, by End User, 2019–2025 (USD Million)
Table 31 Middle East & Africa: Medical Holography Market, by Product, 2019–2025 (USD Million)
Table 32 Middle East & Africa: Medical Holography Market, by Application, 2019–2025 (USD Million)
Table 33 Middle East & Africa: Medical Holography Market, by End User, 2019–2025 (USD Million)
LIST OF FIGURES
Figure 1 Research Process
Figure 2 Market Structure for Global Medical Holography Market
Figure 3 Market Dynamics for Global Medical Holography Market
Figure 4 Global Medical Holography Market Share, by Type, 2018 (%)
Figure 5 Global Medical Holography Market Share, by Application, 2018 (%)
Figure 6 Global Medical Holography Market Share, by End User, 2018 (%)
Figure 7 Global Medical Holography Market Share, by Region, 2018 (%)
Figure 8 North America: Medical Holography Market Share, by Country, 2018 (%)
Figure 9 Europe: Medical Holography Market Share, by Region, 2018 (%)
Figure 10 Western Europe: Medical Holography Market Share, by Country, 2018 (%)
Figure 11 Asia-Pacific: Medical Holography Market Share, by Country, 2018 (%)
Figure 12 Middle East & Africa: Medical Holography Market Share, by Country, 2018 (%)
Figure 13 Global Medical Holography Market: Company Share Analysis, 2018 (%)
Figure 14 Holoxica Limited: Key Financial Overview
Figure 15 Holoxica Limited: Segmental Revenue
Figure 16 Holoxica Limited: Geographic Revenue
Figure 17 EON Reality, Inc.: Key Financial Overview
Figure 18 EON Reality, Inc.: Segmental Revenue
Figure 19 EON Reality, Inc.: Geographic Revenue
Figure 20 Zspace, Inc.: Key Financial Overview
Figure 21 Zspace, Inc.: Segmental Revenue
Figure 22 Zspace, Inc.: Geographic Revenue
Figure 23 Ovizio Imaging Systems NV/SA: Key Financial Overview
Figure 24 Ovizio Imaging Systems NV/SA: Segmental Revenue
Figure 25 Ovizio Imaging Systems NV/SA: Geographic Revenue
Figure 26 Zebra Imaging, Inc.: Key Financial Overview
Figure 27 Zebra Imaging, Inc.: Segmental Revenue
Figure 28 Zebra Imaging, Inc.: Geographic Revenue
Figure 29 Echopixel: Key Financial Overview
Figure 30 Echopixel: Segmental Revenue
Figure 31 Echopixel: Geographic Revenue
Figure 32 Realview Imaging Ltd.: Key Financial Overview
Figure 33 Realview Imaging Ltd.: Segmental Revenue
Figure 34 Realview Imaging Ltd.: Geographic Revenue
Figure 35 Mach7 Technologies Limited: Key Financial Overview
Figure 36 Mach7 Technologies Limited: Segmental Revenue
Figure 37 Mach7 Technologies Limited: Geographic Revenue
Figure 38 Lyncée Tec SA: Key Financial Overview
Figure 39 Lyncée Tec SA: Segmental Revenue
Figure 40 Lyncée Tec SA: Geographic Revenue
Figure 41 Nanolive SA: Key Financial Overview
Figure 42 Nanolive SA: Segmental Revenue
Figure 43 Nanolive SA: Geographic Revenue