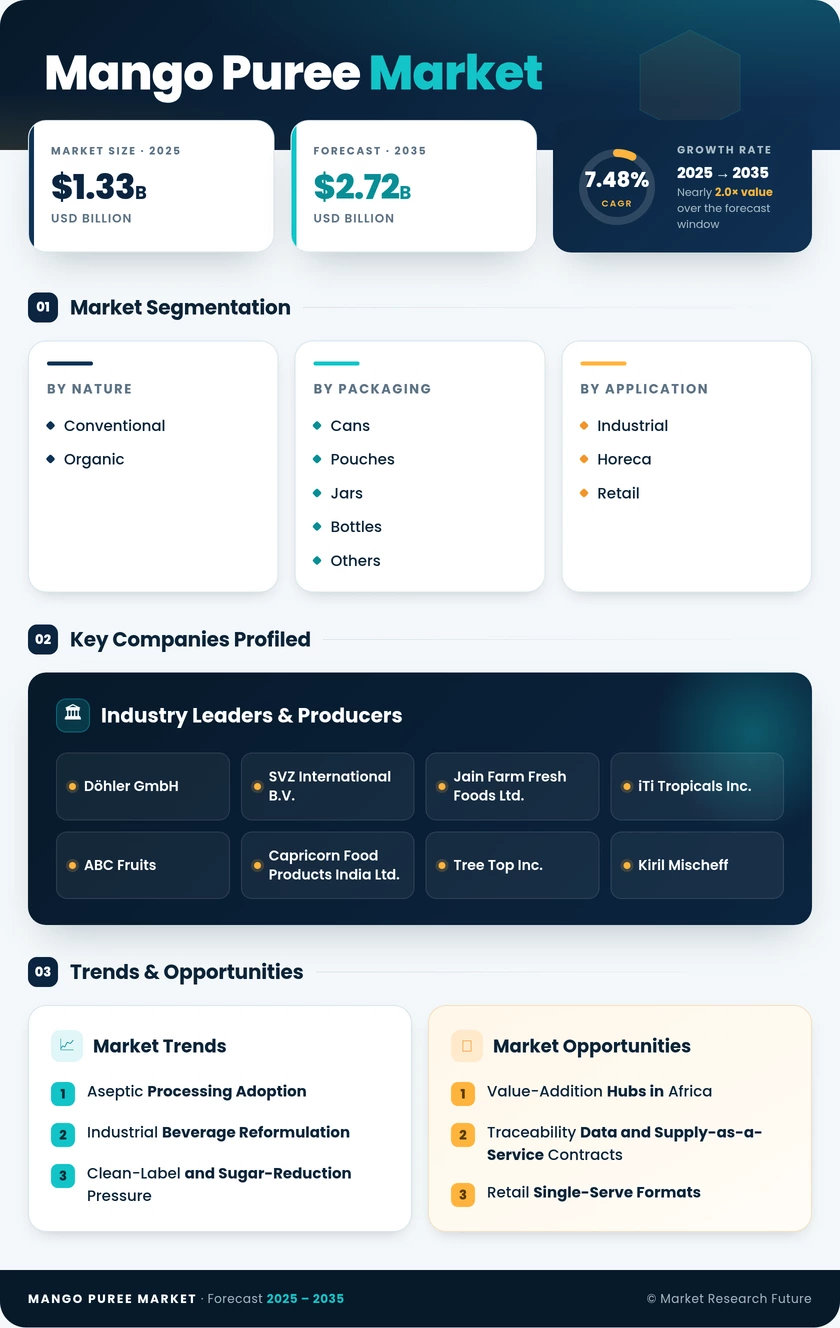
Mango Puree Market (2026 - 2035)

ID: MRFR/FnB/25575-HCR 128 Pages Snehal Singh Last Updated: October 09, 2026
Mango Puree Market Size, Share, Industry Trend & Analysis Research Report By Nature (Conventional, Organic), By Packaging (Cans, Pouches, Jars, Bottles, Others), By End User (Industrial, Horeca, Retail), By Region (North America, Europe, Asia-Pacific, South America, Middle East & Africa) - Forecast to 2035
Mango Puree Market
Market Size
Forecast Period2026-2035
CAGR (2026-2035)7.48%
2025 Market SizeUSD 1.33 Billion
2035 Market SizeUSD 2.72 Billion
Key Players
Döhler GmbH
SVZ International B.V.
Jain Farm Fresh Foods Ltd.
iTi Tropicals Inc.
ABC Fruits
Capricorn Food Products India Ltd.
Opportunities
  • Value-Addition Hubs in Africa
  • Traceability Data and Supply-as-a-Service Contracts
  • Retail Single-Serve Formats
  1. 1 Market Summary | |
  2. 2 Key Report Takeaways | |
    1. 2.1 By Nature | |
    2. 2.2 By Packaging | |
    3. 2.3 By End User | |
    4. 2.4 By Region | |
  3. 3 Market Size and Forecast (2021–2035) | |
  4. 4 Driver Impact Analysis | |
    1. 4.1 Aseptic Processing Adoption | |
    2. 4.2 Industrial Beverage Reformulation | |
    3. 4.3 Clean-Label and Sugar-Reduction Pressure | |
    4. 4.4 Infant and Early-Life Nutrition Demand | |
    5. 4.5 Producer-Country Processing Incentives | |
    6. 4.6 Organic Certification and Premium Channels | |
    7. 4.7 Plant-Based Desserts and Dairy Alternatives | |
  5. 5 Restraints Impact Analysis | |
    1. 5.1 Climate-Driven Harvest Volatility | |
    2. 5.2 Raw Material and Packaging Cost Swings | |
    3. 5.3 Organic Compliance Costs | |
    4. 5.4 Pesticide Residue Limits and Import Rejections | |
    5. 5.5 Substitution and Sugar Scrutiny | |
  6. 6 Opportunities | |
    1. 6.1 Value-Addition Hubs in Africa | |
    2. 6.2 Traceability Data and Supply-as-a-Service Contracts | |
    3. 6.3 Retail Single-Serve Formats | |
    4. 6.4 Upcycled Mango By-Products | |
    5. 6.5 GI-Tagged Varietal Premiums | |
  7. 7 Regional Market Share and Country-Level Analysis | |
    1. 7.1 North America | | |
      1. 7.1.1 US | | |
      2. 7.1.2 Canada | | |
      3. 7.1.3 Mexico | |
    2. 7.2 Europe | | |
      1. 7.2.1 Germany | | |
      2. 7.2.2 UK | | |
      3. 7.2.3 France | | |
      4. 7.2.4 Italy | | |
      5. 7.2.5 Spain | | |
      6. 7.2.6 Nordic Countries | | |
      7. 7.2.7 Russia | | |
      8. 7.2.8 Rest of Europe | |
    3. 7.3 Asia-Pacific | | |
      1. 7.3.1 China | | |
      2. 7.3.2 India | | |
      3. 7.3.3 Japan | | |
      4. 7.3.4 South Korea | | |
      5. 7.3.5 ASEAN | | |
      6. 7.3.6 Rest of Asia-Pacific | |
    4. 7.4 South America | | |
      1. 7.4.1 Brazil | | |
      2. 7.4.2 Argentina | | |
      3. 7.4.3 Rest of South America | |
    5. 7.5 Middle East & Africa | | |
      1. 7.5.1 Saudi Arabia | | |
      2. 7.5.2 UAE | | |
      3. 7.5.3 South Africa | | |
      4. 7.5.4 Egypt | | |
      5. 7.5.5 Rest of MEA | |
  8. 8 Future Outlook (2026–2035) | |
    1. 8.1 Automated Sorting and Process Control | |
    2. 8.2 Climate-Resilient, Multi-Origin Sourcing | |
    3. 8.3 Packaging Circularity | |
    4. 8.4 Functional and Fortified Nutrition | |
  9. 9 Segmentation Analysis | |
    1. 9.1 By Nature | | |
      1. 9.1.1 Conventional | | |
      2. 9.1.2 Organic | |
    2. 9.2 By Packaging | | |
      1. 9.2.1 Cans | | |
      2. 9.2.2 Pouches | | |
      3. 9.2.3 Jars | | |
      4. 9.2.4 Bottles | | |
      5. 9.2.5 Others | |
    3. 9.3 By End User | | |
      1. 9.3.1 Industrial | | |
      2. 9.3.2 Horeca | | |
      3. 9.3.3 Retail | |
  10. 10 Competitive Landscape | |
    1. 10.1 Market Concentration Overview | |
    2. 10.2 Competitive Benchmarking | |
    3. 10.3 Company Profiles | | |
      1. 10.3.1 Döhler GmbH | | |
      2. 10.3.2 SVZ International B.V. | | |
      3. 10.3.3 Jain Farm Fresh Foods Ltd. | | |
      4. 10.3.4 iTi Tropicals Inc. | | |
      5. 10.3.5 ABC Fruits | | |
      6. 10.3.6 Capricorn Food Products India Ltd. | | |
      7. 10.3.7 Tree Top Inc. | | |
      8. 10.3.8 Kiril Mischeff | | |
      9. 10.3.9 Ariza B.V. | | |
      10. 10.3.10 Galla Foods | |
  11. 11 Recent News and Developments | |
  12. 12 Report Scope and Methodology | |
  13. 13 Detailed Sources and Citations | |
  14. 14 Frequently Asked Questions (FAQs) | | LIST OF TABLES | |
  15. TABLE 1 Global Mango Puree Market Summary, 2025–2035 | |
  16. TABLE 2 Global Market Size and Forecast, by Revenue (USD Billion), 2021–2035 | |
  17. TABLE 3 Driver Impact Analysis, 2026–2035 | |
  18. TABLE 4 Restraints Impact Analysis, 2026–2035 | |
  19. TABLE 5 Regional Summary, 2025 | |
  20. TABLE 6 North America Market, by Country, 2025 | |
  21. TABLE 7 Europe Market, by Country, 2025 | |
  22. TABLE 8 Asia-Pacific Market, by Country, 2025 | |
  23. TABLE 9 South America Market, by Country, 2025 | |
  24. TABLE 10 Middle East & Africa Market, by Country, 2025 | |
  25. TABLE 11 Market Segmentation, by Nature, 2025 | |
  26. TABLE 12 Market Segmentation, by Packaging, 2025 | |
  27. TABLE 13 Market Segmentation, by End User, 2025 | |
  28. TABLE 14 Competitive Benchmarking Matrix, 2025 | |
  29. TABLE 15 Report Scope and Methodology | |
  30. TABLE 16 Detailed Sources and Citations | | LIST OF FIGURES | |
  31. FIGURE 1 Market Dynamics Overview (Drivers, Restraints, Opportunities) | |
  32. FIGURE 2 Industry Value Chain Analysis | |
  33. FIGURE 3 Porter's Five Forces Analysis | |
  34. FIGURE 4 Global Market Size Trend (USD Billion), 2021–2035 | |
  35. FIGURE 5 Market Share, by Nature, 2025 | |
  36. FIGURE 6 Market Share, by Packaging, 2025 | |
  37. FIGURE 7 Market Share, by End User, 2025 | |
  38. FIGURE 8 Regional Market Share, 2025 | |
  39. FIGURE 9 Regional Growth Comparison (CAGR), 2026–2035 | |
  40. FIGURE 10 Competitive Landscape Positioning Map, 2025

Segmentation Quick Reference

DimensionSub-SegmentsDominant SegmentFastest Growing Segment
By NatureConventional, OrganicConventional (75.1% share)Organic (9.5% CAGR)
By PackagingCans, Pouches, Jars, Bottles, OthersCans (55.6% share)Bottles (7.9% CAGR)
By End UserIndustrial, Horeca, RetailIndustrial (70.4% share)Retail (9.9% CAGR)
By RegionNorth America, Europe, Asia-Pacific, South America, Middle East & AfricaAsia-Pacific (41.0% share)Middle East & Africa (8.8% CAGR)


Market Segmentation Overview

By Nature

Sub-SegmentKey Trend
ConventionalScale processing and multi-fruit lines lower unit cost for industrial contracts
OrganicCertified supply expands under SOE and EU import rules for premium retail and baby food


Conventional puree leads with a 75.1% share because established orchards, standardized aseptic processing, and low per-tonne cost suit beverage and dairy manufacturers. Organic grows fastest at a 9.5% CAGR as baby food makers and premium retailers pay for certified, residue-controlled supply. The three-year conversion requirement keeps organic volumes tight, which sustains its price premium over conventional product.

By Packaging

Sub-SegmentKey Trend
CansRemain the standard bulk format for ambient industrial supply
PouchesMono-material recyclable films gain under EU packaging rules
JarsHold steady in gourmet and diaspora retail
BottlesSingle-serve, ready-to-blend formats lead retail growth
OthersBag-in-box and frozen blocks serve Horeca and specialty buyers


Cans dominate with a 55.6% share because they protect quality at ambient storage and fit high-volume beverage plants. Bottles grow fastest at a 7.9% CAGR as shoppers buy portion-controlled puree for home smoothies and desserts. Pouches follow close behind, helped by lighter freight weight and recyclability requirements under the EU Packaging and Packaging Waste Regulation.

By End User

Sub-SegmentKey Trend
IndustrialLong-term contracts and custom formulations for beverage and dairy makers
HorecaBulk buying by juice bars, hotels, and caterers on price and taste
RetailPremium single-serve and organic products for home use


Industrial buyers lead with a 70.4% share, relying on annual contracts, tight Brix and pH specifications, and processor technical support. Retail is the fastest-growing end user at a 9.9% CAGR, driven by home smoothie, lassi, dessert, and infant food use. Horeca sits between the two, buying bulk packs where cost and flavor matter more than branding.


Download PDF ×

We do not share your information with anyone. However, we may send you emails based on your report interest from time to time. You may contact us at any time to opt-out.