Malware Analysis Market (2026 - 2035)

ID: MRFR/ICT/30689-HCR 100 Pages Aarti Dhapte Last Updated: October 24, 2026
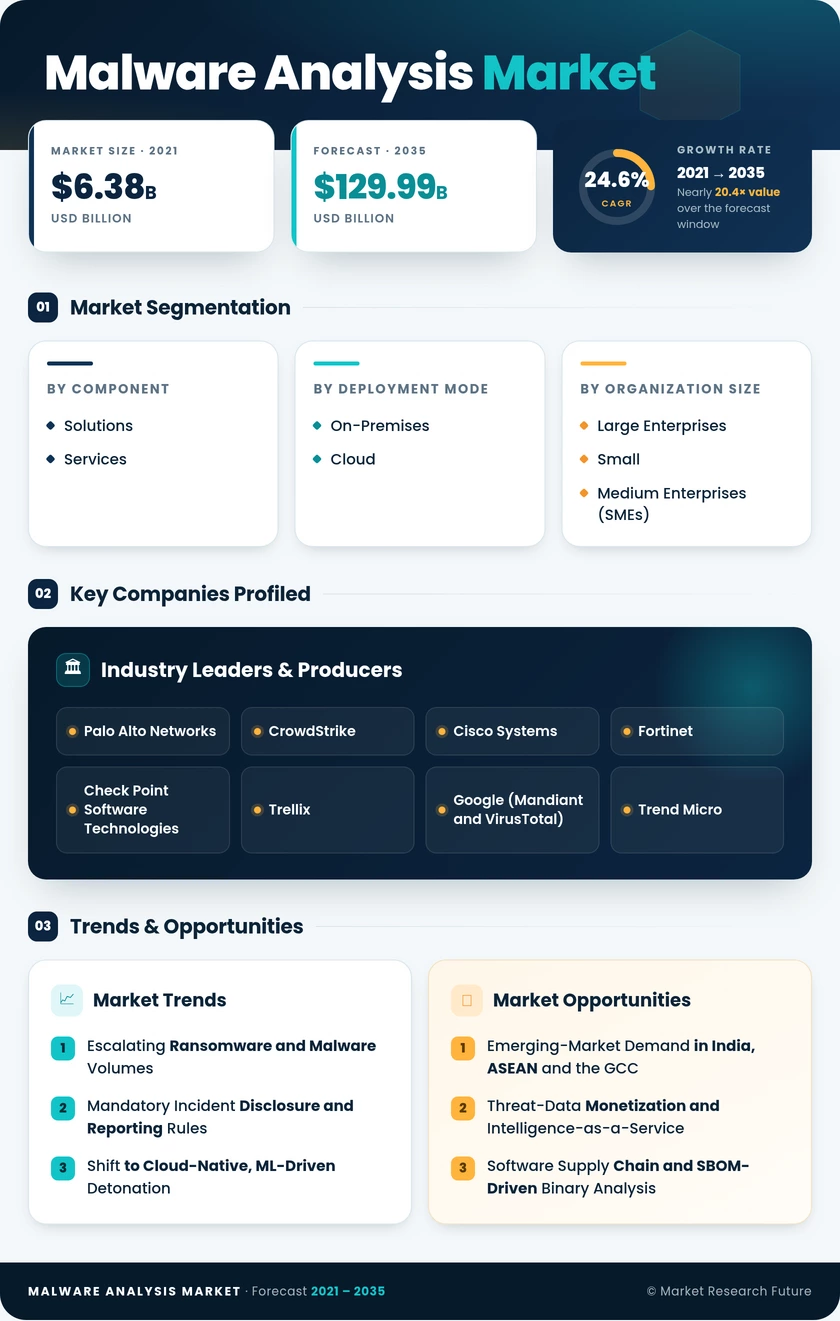
Malware Analysis Market Size, Share and Research Report: By Service Type (Static Analysis, Dynamic Analysis, Behavioral Analysis, Sandboxing), By Deployment Type (On-Premise, Cloud-Based, Hybrid), By End Use Industry (BFSI, Healthcare, IT Telecommunication, Government), By Solution Type (Malware Detection, Incident Response, Threat Intelligence, Consulting Services) and By Regional (North America, Europe, South America, Asia Pacific, Middle East and Africa) - Industry Forecast to 2035
Malware Analysis Market
Market Size
Forecast Period2026-2035
CAGR (2026-2035)24.6%
2025 Market SizeUSD 14.42 Billion
2035 Market SizeUSD 129.99 Billion
Key Players
Palo Alto Networks
CrowdStrike
Cisco Systems
Fortinet
Check Point Software Technologies
Trellix
Opportunities
  • Emerging-Market Demand in India, ASEAN and the GCC
  • Threat-Data Monetization and Intelligence-as-a-Service
  • Software Supply Chain and SBOM-Driven Binary Analysis
  1. 1 Market Summary | |
  2. 2 Key Report Takeaways | |
    1. 2.1 By Component | |
    2. 2.2 By Deployment Mode | |
    3. 2.3 By Organization Size | |
    4. 2.4 By Industry Vertical | |
    5. 2.5 By Analysis Technique | |
    6. 2.6 By Region | |
  3. 3 Market Size and Forecast (2021–2035) | |
  4. 4 Driver Impact Analysis | |
    1. 4.1 Escalating Ransomware and Malware Volumes | |
    2. 4.2 Mandatory Incident Disclosure and Reporting Rules | |
    3. 4.3 Shift to Cloud-Native, ML-Driven Detonation | |
    4. 4.4 Attacks on Healthcare and Critical Infrastructure | |
    5. 4.5 Zero Trust and Federal Security Mandates | |
    6. 4.6 Managed Security and Insurance-Driven SME Adoption | |
  5. 5 Restraints Impact Analysis | |
    1. 5.1 Shortage of Skilled Malware Analysts | |
    2. 5.2 Sandbox-Evasive and Fileless Malware | |
    3. 5.3 High Total Cost of Ownership for SMEs | |
    4. 5.4 Data Residency Limits on Sample Sharing | |
    5. 5.5 False Positives and Alert Fatigue | |
  6. 6 Opportunities | |
    1. 6.1 Emerging-Market Demand in India, ASEAN and the GCC | |
    2. 6.2 Threat-Data Monetization and Intelligence-as-a-Service | |
    3. 6.3 Software Supply Chain and SBOM-Driven Binary Analysis | |
    4. 6.4 Operational Technology and IoT Firmware Analysis | |
    5. 6.5 Analysis Embedded in Insurance and MSP Bundles | |
  7. 7 Regional Market Share and Country-Level Analysis | |
    1. 7.1 North America | | |
      1. 7.1.1 US | | |
      2. 7.1.2 Canada | | |
      3. 7.1.3 Mexico | |
    2. 7.2 Europe | | |
      1. 7.2.1 Germany | | |
      2. 7.2.2 UK | | |
      3. 7.2.3 France | | |
      4. 7.2.4 Italy | | |
      5. 7.2.5 Spain | | |
      6. 7.2.6 Nordic Countries | | |
      7. 7.2.7 Russia | | |
      8. 7.2.8 Rest of Europe | |
    3. 7.3 Asia-Pacific | | |
      1. 7.3.1 China | | |
      2. 7.3.2 India | | |
      3. 7.3.3 Japan | | |
      4. 7.3.4 South Korea | | |
      5. 7.3.5 ASEAN | | |
      6. 7.3.6 Rest of Asia-Pacific | |
    4. 7.4 South America | | |
      1. 7.4.1 Brazil | | |
      2. 7.4.2 Argentina | | |
      3. 7.4.3 Rest of South America | |
    5. 7.5 Middle East & Africa | | |
      1. 7.5.1 Saudi Arabia | | |
      2. 7.5.2 UAE | | |
      3. 7.5.3 South Africa | | |
      4. 7.5.4 Egypt | | |
      5. 7.5.5 Rest of MEA | |
  8. 8 Future Outlook (2026–2035) | |
    1. 8.1 Agentic AI and Autonomous Triage | |
    2. 8.2 Platform Consolidation | |
    3. 8.3 Regulatory Convergence | |
    4. 8.4 AI-Generated Malware and the Detection Arms Race | |
  9. 9 Segmentation Analysis | |
    1. 9.1 By Component | | |
      1. 9.1.1 Solutions | | |
      2. 9.1.2 Services | |
    2. 9.2 By Deployment Mode | | |
      1. 9.2.1 On-Premises | | |
      2. 9.2.2 Cloud | |
    3. 9.3 By Organization Size | | |
      1. 9.3.1 Large Enterprises | | |
      2. 9.3.2 Small and Medium Enterprises (SMEs) | |
    4. 9.4 By Industry Vertical | | |
      1. 9.4.1 BFSI | | |
      2. 9.4.2 Government and Defense | | |
      3. 9.4.3 Healthcare and Life Sciences | | |
      4. 9.4.4 IT and Telecom | | |
      5. 9.4.5 Retail and E-commerce | | |
      6. 9.4.6 Manufacturing | | |
      7. 9.4.7 Energy and Utilities | | |
      8. 9.4.8 Others | |
    5. 9.5 By Analysis Technique | | |
      1. 9.5.1 Static Analysis | | |
      2. 9.5.2 Dynamic Analysis | | |
      3. 9.5.3 Hybrid/ML-assisted Analysis | |
  10. 10 Competitive Landscape | |
    1. 10.1 Market Concentration Analysis | |
    2. 10.2 Competitive Benchmarking Matrix | |
    3. 10.3 Company Profiles | | |
      1. 10.3.1 Palo Alto Networks | | |
      2. 10.3.2 CrowdStrike | | |
      3. 10.3.3 Cisco Systems | | |
      4. 10.3.4 Fortinet | | |
      5. 10.3.5 Check Point Software Technologies | | |
      6. 10.3.6 Trellix | | |
      7. 10.3.7 Google (Mandiant and VirusTotal) | | |
      8. 10.3.8 Trend Micro | | |
      9. 10.3.9 Sophos | | |
      10. 10.3.10 Kaspersky | | |
      11. 10.3.11 OPSWAT | | |
      12. 10.3.12 ReversingLabs | |
  11. 11 Recent News & Developments | |
  12. 12 Report Scope and Methodology | |
  13. 13 Detailed Sources and Citations | |
  14. 14 Frequently Asked Questions (FAQs) | | LIST OF TABLES | |
  15. TABLE 1 Global Market Size and Forecast, by Revenue (USD Billion), 2021–2035 | |
  16. TABLE 2 Global Market Year-over-Year Growth Analysis, 2021–2035 | |
  17. TABLE 3 Driver Impact Analysis, 2026–2035 | |
  18. TABLE 4 Restraints Impact Analysis, 2026–2035 | |
  19. TABLE 5 Regional Summary, 2025 | |
  20. TABLE 6 North America Market, by Country, 2021–2035 (USD Billion) | |
  21. TABLE 7 Europe Market, by Country, 2021–2035 (USD Billion) | |
  22. TABLE 8 Asia-Pacific Market, by Country, 2021–2035 (USD Billion) | |
  23. TABLE 9 South America Market, by Country, 2021–2035 (USD Billion) | |
  24. TABLE 10 Middle East & Africa Market, by Country, 2021–2035 (USD Billion) | |
  25. TABLE 11 Global Market, by Component, 2021–2035 (USD Billion) | |
  26. TABLE 12 Global Market, by Deployment Mode, 2021–2035 (USD Billion) | |
  27. TABLE 13 Global Market, by Organization Size, 2021–2035 (USD Billion) | |
  28. TABLE 14 Global Market, by Industry Vertical, 2021–2035 (USD Billion) | |
  29. TABLE 15 Global Market, by Analysis Technique, 2021–2035 (USD Billion) | |
  30. TABLE 16 Competitive Benchmarking Matrix, 2025 | |
  31. TABLE 17 Recent Developments and Strategic Announcements, 2024–2025 | |
  32. TABLE 18 Report Scope and Methodology | |
  33. TABLE 19 Detailed Sources and Citations | | LIST OF FIGURES | |
  34. FIGURE 1 Market Dynamics Overview (Drivers, Restraints, Opportunities) | |
  35. FIGURE 2 Industry Value Chain Analysis | |
  36. FIGURE 3 Porter's Five Forces Analysis | |
  37. FIGURE 4 Global Market Size Trend, 2021–2035 (USD Billion) | |
  38. FIGURE 5 Year-over-Year Growth Rate, 2022–2035 | |
  39. FIGURE 6 Market Share by Component, 2025 | |
  40. FIGURE 7 Market Share by Deployment Mode, 2025 | |
  41. FIGURE 8 Market Share by Organization Size, 2025 | |
  42. FIGURE 9 Market Share by Industry Vertical, 2025 | |
  43. FIGURE 10 Market Share by Analysis Technique, 2025 | |
  44. FIGURE 11 Regional Market Share, 2025 | |
  45. FIGURE 12 Regional Growth Comparison, 2026–2035 CAGR | |
  46. FIGURE 13 Competitive Landscape Positioning Map, 2025 | |
  47. FIGURE 14 Estimated Vendor Revenue Share Ranges, 2025

Segmentation Quick Reference

Dimension Sub-Segments Dominant Segment Fastest Growing Segment
By Component Solutions; Services Solutions (71.0% share) Solutions
By Deployment Mode On-Premises; Cloud Cloud Cloud (25.3% CAGR)
By Organization Size Large Enterprises; Small and Medium Enterprises (SMEs) Large Enterprises (66.4% share) Small and Medium Enterprises (SMEs) (26.4% CAGR)
By Industry Vertical BFSI; Government and Defense; Healthcare and Life Sciences; IT and Telecom; Retail and E-commerce; Manufacturing; Energy and Utilities; Others BFSI (25.4% share) Healthcare and Life Sciences (26.9% CAGR)
By Analysis Technique Static Analysis; Dynamic Analysis; Hybrid/ML-assisted Analysis Static Analysis (43.9% share) Hybrid/ML-assisted Analysis (27.6% CAGR)
By Region North America; Europe; Asia-Pacific; South America; Middle East & Africa North America (37.8% share) Asia-Pacific (28.1% CAGR)


Market Segmentation Overview

By Component

Sub-Segment Key Trend
Solutions Consolidation of detonation, ML scoring and orchestration into single platforms
Services Retainer-based forensics and managed threat hunting


Solutions lead the component split and also grow faster than Services because one console can detonate, score and route a sample to response without manual hand-offs. Services grow more slowly since incident forensics and threat hunting depend on scarce reverse engineers. Vendors increasingly embed guided triage into Solutions, reducing the share of work that requires paid service hours.

By Deployment Mode

Sub-Segment Key Trend
On-Premises Private enclaves and air-gapped analysis for regulated buyers
Cloud Serverless parallel detonation with continuous model updates


Cloud is both the leading and fastest-growing deployment mode, as elastic capacity lets security teams detonate thousands of samples in parallel and pay only for usage. On-Premises retains a 38.8% share where defense agencies and banks must keep sample artifacts within controlled boundaries. Hybrid architectures that keep sensitive files local while outsourcing bulk scoring are bridging the two models.

By Organization Size

Sub-Segment Key Trend
Large Enterprises In-house SOCs integrating analysis with SIEM and SOAR
Small and Medium Enterprises (SMEs) Managed, per-endpoint subscriptions bundled by MSPs


Large Enterprises dominate spending because they run dedicated security operations centers and face direct disclosure liability under SEC and NIS2 rules. Small and Medium Enterprises (SMEs) grow fastest as managed service providers package cloud detonation with monitoring in affordable per-endpoint plans. Insurance underwriting requirements are the main trigger converting smaller firms from free scanners to paid analysis.

By Industry Vertical

Sub-Segment Key Trend
BFSI DORA-driven incident classification and banking trojan defense
Government and Defense Air-gapped reverse engineering against state actors
Healthcare and Life Sciences Ransomware protection for records and medical devices
IT and Telecom Supply chain and network infrastructure inspection
Retail and E-commerce Payment skimmer and web-script analysis
Manufacturing OT firmware and industrial controller analysis
Energy and Utilities Grid and pipeline security compliance
Others Education and transport digitization


BFSI holds the largest vertical share because banks combine high-value data with strict supervisory reporting under DORA. Healthcare and Life Sciences expands fastest as attacks on hospitals push providers toward continuous inspection of health record servers and imaging endpoints. Government and Defense sustains high spending on air-gap-compatible tools, while Manufacturing adds demand for firmware emulation.

By Analysis Technique

Sub-Segment Key Trend
Static Analysis High-speed pre-execution screening and file reputation
Dynamic Analysis Behavioral detonation feeding model retraining
Hybrid/ML-assisted Analysis Combined signature and behavioral scoring for evasive code


Static Analysis remains the largest technique because it screens files at scale without execution cost. Hybrid/ML-assisted Analysis grows fastest by fusing static features with Dynamic Analysis telemetry, catching sandbox-aware and polymorphic samples that single methods miss. Vendors now train hybrid models continuously on detonation output, making behavioral data the core competitive asset.


Download PDF ×

We do not share your information with anyone. However, we may send you emails based on your report interest from time to time. You may contact us at any time to opt-out.