Laser Technology Market (2026 - 2035)

ID: MRFR/ICT/3673-HCR
200 Pages
Ankit Gupta
Last Updated: July 03, 2026
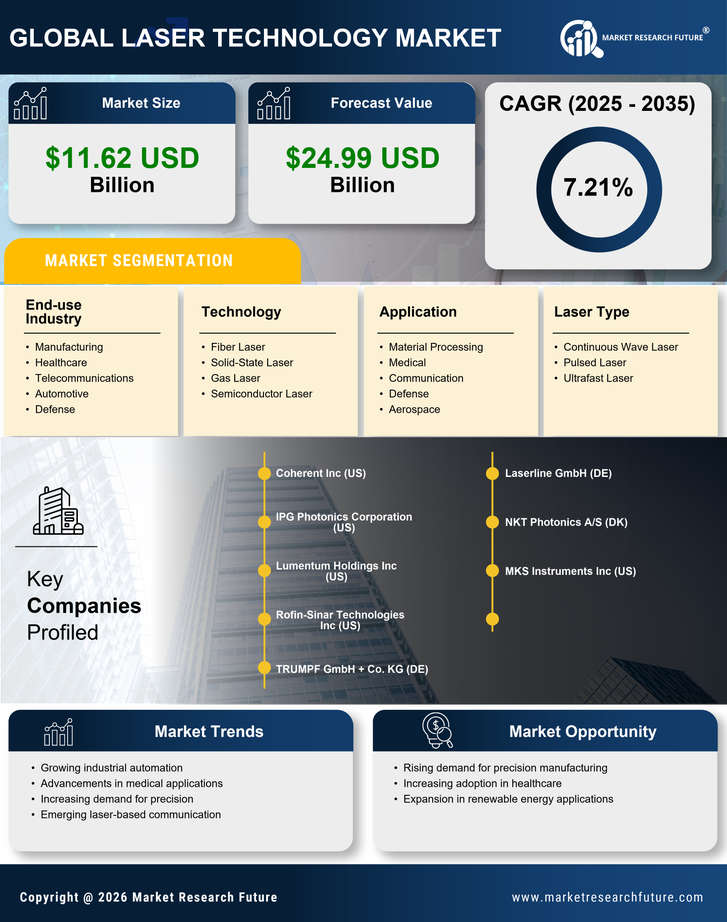
Laser Technology Market Size, Share and Research Report: By Technology (Fiber Laser, Solid-State Laser, Gas Laser, Semiconductor Laser), By Application (Material Processing, Medical, Communication, Defense, Aerospace), By End-use Industry (Manufacturing, Healthcare, Telecommunications, Automotive, Defense), By Laser Type (Continuous Wave Laser, Pulsed Laser, Ultrafast Laser), and By Regional (North America, Europe, South America, Asia Pacific, Middle East and Africa) - Industry Forecast to 2035
Laser Technology Market
Market Size
Forecast Period2026-2035
CAGR (2026-2035)7.55%
2025 Market SizeUSD 21.25 Billion
2035 Market SizeUSD 44.00 Billion
Key Players
Coherent Corp.
TRUMPF
IPG Photonics
Han's Laser Technology
Lumentum Holdings
Jenoptik AG
Opportunities
  • AI-Guided Laser Process Optimization
  • Green Steel and Decarbonization Applications
  • Emerging-Market Photonics Industrialization
  1. 1 Market Overview |
    1. 1.1 Study Assumptions & Market Definition |
    2. 1.2 Scope of the Study |
    3. 1.3 Research Methodology
  2. 2 Market Summary & Key Takeaways
  3. 3 Market Dynamics |
    1. 3.1 Market Drivers Analysis | |
      1. 3.1.1 EV Battery and E-Mobility Manufacturing Expansion | |
      2. 3.1.2 Advanced Semiconductor Packaging Demand | |
      3. 3.1.3 Defense Directed-Energy and LiDAR Programs | |
      4. 3.1.4 Medical and Cosmetic Laser Adoption | |
      5. 3.1.5 Decarbonization of Heavy Industry | |
      6. 3.1.6 Photonics Manufacturing Reshoring Incentives | |
      7. 3.1.7 Autonomous-Vehicle LiDAR Integration |
    2. 3.2 Market Restraints Analysis | |
      1. 3.2.1 High Capital and Maintenance Costs for Industrial Lasers | |
      2. 3.2.2 Laser Safety Regulations and Compliance Burden | |
      3. 3.2.3 Shortage of Skilled Laser Process Engineers | |
      4. 3.2.4 Supply-Chain Concentration for Rare-Earth Doped Fibers | |
      5. 3.2.5 Thermal Management Limitations at Ultra-High Powers |
    3. 3.3 Market Opportunity Analysis | |
      1. 3.3.1 AI-Guided Laser Process Optimization | |
      2. 3.3.2 Green Steel and Decarbonization Applications | |
      3. 3.3.3 Emerging-Market Photonics Industrialization | |
      4. 3.3.4 Drone-Based and Satellite LiDAR Systems | |
      5. 3.3.5 Laser-as-a-Service Business Models |
    4. 3.4 Industry Value Chain Analysis |
    5. 3.5 Porter's Five Forces Analysis
  4. 4 Global Laser Technology Market Size & Forecast (2021–2035) |
    1. 4.1 Historical Market Size (2021–2025) |
    2. 4.2 Current & Forecast Market Size (2026–2035) |
    3. 4.3 Market Size by Revenue (USD Billion) |
    4. 4.4 Year-over-Year Growth Analysis
  5. 5 Segmentation Analysis |
    1. 5.1 By Technology | |
      1. 5.1.1 CO₂ Laser | |
      2. 5.1.2 Fiber Laser | |
      3. 5.1.3 Solid-State Laser | |
      4. 5.1.4 Semiconductor & Diode Laser | |
      5. 5.1.5 Other (Excimer, Gas, Dye) |
    2. 5.2 By Power Output | |
      1. 5.2.1 Low-Power ( 10 kW) |
    3. 5.3 By Application | |
      1. 5.3.1 Material Processing | |
      2. 5.3.2 Medical & Cosmetics | |
      3. 5.3.3 Communication & Optical Storage | |
      4. 5.3.4 Automotive LiDAR | |
      5. 5.3.5 Defense & Security | |
      6. 5.3.6 Other (R&D, Entertainment) |
    4. 5.4 By End-Use Industry | |
      1. 5.4.1 Electronics | |
      2. 5.4.2 Automotive | |
      3. 5.4.3 Aerospace & Defense | |
      4. 5.4.4 Healthcare | |
      5. 5.4.5 Heavy Industry & Energy | |
      6. 5.4.6 Other (Telecom, R&D)
  6. 6 Regional Analysis |
    1. 6.1 North America | |
      1. 6.1.1 United States | |
      2. 6.1.2 Canada | |
      3. 6.1.3 Mexico |
    2. 6.2 Europe | |
      1. 6.2.1 Germany | |
      2. 6.2.2 United Kingdom | |
      3. 6.2.3 France | |
      4. 6.2.4 Italy | |
      5. 6.2.5 Spain | |
      6. 6.2.6 Nordic Countries | |
      7. 6.2.7 Russia | |
      8. 6.2.8 Rest of Europe |
    3. 6.3 Asia-Pacific | |
      1. 6.3.1 China | |
      2. 6.3.2 Japan | |
      3. 6.3.3 India | |
      4. 6.3.4 South Korea | |
      5. 6.3.5 ASEAN | |
      6. 6.3.6 Rest of Asia-Pacific |
    4. 6.4 South America | |
      1. 6.4.1 Brazil | |
      2. 6.4.2 Argentina | |
      3. 6.4.3 Rest of South America |
    5. 6.5 Middle East & Africa | |
      1. 6.5.1 Saudi Arabia | |
      2. 6.5.2 UAE | |
      3. 6.5.3 South Africa | |
      4. 6.5.4 Egypt | |
      5. 6.5.5 Rest of MEA
  7. 7 Competitive Landscape |
    1. 7.1 Market Share Analysis (2025) |
    2. 7.2 Competitive Benchmarking Matrix |
    3. 7.3 Company Profiles | |
      1. 7.3.1 Coherent Corp. | |
      2. 7.3.2 TRUMPF | |
      3. 7.3.3 IPG Photonics | |
      4. 7.3.4 Han's Laser Technology | |
      5. 7.3.5 Lumentum Holdings | |
      6. 7.3.6 Jenoptik AG | |
      7. 7.3.7 nLIGHT Inc. | |
      8. 7.3.8 Lumibird | |
      9. 7.3.9 Hamamatsu Photonics | |
      10. 7.3.10 MKS Instruments
  8. 8 Future Outlook & Strategic Recommendations (2026–2035) |
    1. 8.1 AI-Integrated Laser Manufacturing |
    2. 8.2 Electrification Supercycle |
    3. 8.3 Photonics Platform Convergence |
    4. 8.4 ESG-Driven Efficiency Mandates
  9. 9 Recent Developments & News
  10. 10 Frequently Asked Questions (FAQs)
  11. 11 Report Scope & Methodology |
    1. 11.1 Study Period & Base Year |
    2. 11.2 Data Sources & Citations |
    3. 11.3 Abbreviations
  12. 12 LIST OF TABLES |
  13. TABLE 1 Global Laser Technology Market Size & Forecast, by Revenue (USD Billion), 2021–2035 |
  14. TABLE 2 Global Laser Technology Market – Year-over-Year Growth Analysis, 2021–2035 |
  15. TABLE 3 Global Laser Technology Market – Driver Impact Analysis |
  16. TABLE 4 Global Laser Technology Market – Restraint Impact Analysis |
  17. TABLE 5 Global Laser Technology Market Size, by Technology, 2021–2035 (USD Billion) |
  18. TABLE 6 Global Laser Technology Market Size, by Power Output, 2021–2035 (USD Billion) |
  19. TABLE 7 Global Laser Technology Market Size, by Application, 2021–2035 (USD Billion) |
  20. TABLE 8 Global Laser Technology Market Size, by End-Use Industry, 2021–2035 (USD Billion) |
  21. TABLE 9 Global Laser Technology Market Size, by Region, 2021–2035 (USD Billion) |
  22. TABLE 10 North America Laser Technology Market Size, by Country, 2021–2035 (USD Billion) |
  23. TABLE 11 Europe Laser Technology Market Size, by Country, 2021–2035 (USD Billion) |
  24. TABLE 12 Asia-Pacific Laser Technology Market Size, by Country, 2021–2035 (USD Billion) |
  25. TABLE 13 South America Laser Technology Market Size, by Country, 2021–2035 (USD Billion) |
  26. TABLE 14 Middle East & Africa Laser Technology Market Size, by Country, 2021–2035 (USD Billion) |
  27. TABLE 15 Competitive Benchmarking Matrix – Global Laser Technology Market, 2025 |
  28. TABLE 16 Company Profiles – Key Players, Global Laser Technology Market |
  29. TABLE 17 Recent Developments & Strategic Announcements, 2023–2025 |
  30. TABLE 18 North America Laser Technology Market Size, by Technology, 2021–2035 (USD Billion) |
  31. TABLE 19 North America Laser Technology Market Size, by Power Output, 2021–2035 (USD Billion) |
  32. TABLE 20 North America Laser Technology Market Size, by Application, 2021–2035 (USD Billion) |
  33. TABLE 21 North America Laser Technology Market Size, by End-Use Industry, 2021–2035 (USD Billion) |
  34. TABLE 22 Europe Laser Technology Market Size, by Technology, 2021–2035 (USD Billion) |
  35. TABLE 23 Europe Laser Technology Market Size, by Power Output, 2021–2035 (USD Billion) |
  36. TABLE 24 Europe Laser Technology Market Size, by Application, 2021–2035 (USD Billion) |
  37. TABLE 25 Europe Laser Technology Market Size, by End-Use Industry, 2021–2035 (USD Billion) |
  38. TABLE 26 Asia-Pacific Laser Technology Market Size, by Technology, 2021–2035 (USD Billion) |
  39. TABLE 27 Asia-Pacific Laser Technology Market Size, by Power Output, 2021–2035 (USD Billion) |
  40. TABLE 28 Asia-Pacific Laser Technology Market Size, by Application, 2021–2035 (USD Billion) |
  41. TABLE 29 Asia-Pacific Laser Technology Market Size, by End-Use Industry, 2021–2035 (USD Billion) |
  42. TABLE 30 South America Laser Technology Market Size, by Technology, 2021–2035 (USD Billion) |
  43. TABLE 31 South America Laser Technology Market Size, by Power Output, 2021–2035 (USD Billion) |
  44. TABLE 32 South America Laser Technology Market Size, by Application, 2021–2035 (USD Billion) |
  45. TABLE 33 South America Laser Technology Market Size, by End-Use Industry, 2021–2035 (USD Billion) |
  46. TABLE 34 Middle East & Africa Laser Technology Market Size, by Technology, 2021–2035 (USD Billion) |
  47. TABLE 35 Middle East & Africa Laser Technology Market Size, by Power Output, 2021–2035 (USD Billion) |
  48. TABLE 36 Middle East & Africa Laser Technology Market Size, by Application, 2021–2035 (USD Billion) |
  49. TABLE 37 Middle East & Africa Laser Technology Market Size, by End-Use Industry, 2021–2035 (USD Billion) |
  50. TABLE 38 United States Laser Technology Market Size, by Technology, 2021–2035 (USD Billion) |
  51. TABLE 39 United States Laser Technology Market Size, by Power Output, 2021–2035 (USD Billion) |
  52. TABLE 40 United States Laser Technology Market Size, by Application, 2021–2035 (USD Billion) |
  53. TABLE 41 United States Laser Technology Market Size, by End-Use Industry, 2021–2035 (USD Billion) |
  54. TABLE 42 Canada Laser Technology Market Size, by Technology, 2021–2035 (USD Billion) |
  55. TABLE 43 Canada Laser Technology Market Size, by Application, 2021–2035 (USD Billion) |
  56. TABLE 44 Mexico Laser Technology Market Size, by Technology, 2021–2035 (USD Billion) |
  57. TABLE 45 Mexico Laser Technology Market Size, by Application, 2021–2035 (USD Billion) |
  58. TABLE 46 Germany Laser Technology Market Size, by Technology, 2021–2035 (USD Billion) |
  59. TABLE 47 Germany Laser Technology Market Size, by Application, 2021–2035 (USD Billion) |
  60. TABLE 48 China Laser Technology Market Size, by Technology, 2021–2035 (USD Billion) |
  61. TABLE 49 China Laser Technology Market Size, by Application, 2021–2035 (USD Billion) |
  62. TABLE 50 Japan Laser Technology Market Size, by Technology, 2021–2035 (USD Billion) |
  63. TABLE 51 Japan Laser Technology Market Size, by Application, 2021–2035 (USD Billion) |
  64. TABLE 52 India Laser Technology Market Size, by Technology, 2021–2035 (USD Billion) |
  65. TABLE 53 India Laser Technology Market Size, by Application, 2021–2035 (USD Billion) |
  66. TABLE 54 South Korea Laser Technology Market Size, by Technology, 2021–2035 (USD Billion) |
  67. TABLE 55 South Korea Laser Technology Market Size, by Application, 2021–2035 (USD Billion) |
  68. TABLE 56 Brazil Laser Technology Market Size, by Technology, 2021–2035 (USD Billion) |
  69. TABLE 57 Brazil Laser Technology Market Size, by Application, 2021–2035 (USD Billion) |
  70. TABLE 58 Saudi Arabia Laser Technology Market Size, by Technology, 2021–2035 (USD Billion) |
  71. TABLE 59 Saudi Arabia Laser Technology Market Size, by Application, 2021–2035 (USD Billion) |
  72. TABLE 60 Report Scope & Methodology Summary
  73. 13 LIST OF FIGURES |
  74. FIGURE 1 Global Laser Technology Market Dynamics Overview |
  75. FIGURE 2 Industry Value Chain Analysis — Laser Technology Market |
  76. FIGURE 3 Porter's Five Forces Analysis — Laser Technology Market |
  77. FIGURE 4 Global Laser Technology Market Size Trend & Forecast (USD Billion), 2021–2035 |
  78. FIGURE 5 Global Laser Technology Market Share, by Technology, 2025 |
  79. FIGURE 6 Global Laser Technology Market Share, by Power Output, 2025 |
  80. FIGURE 7 Global Laser Technology Market Share, by Application, 2025 |
  81. FIGURE 8 Global Laser Technology Market Share, by End-Use Industry, 2025 |
  82. FIGURE 9 Global Laser Technology Market Share, by Region, 2025 |
  83. FIGURE 10 North America Laser Technology Market Size & Forecast (USD Billion), 2021–2035 |
  84. FIGURE 11 Europe Laser Technology Market Size & Forecast (USD Billion), 2021–2035 |
  85. FIGURE 12 Asia-Pacific Laser Technology Market Size & Forecast (USD Billion), 2021–2035 |
  86. FIGURE 13 South America Laser Technology Market Size & Forecast (USD Billion), 2021–2035 |
  87. FIGURE 14 Middle East & Africa Laser Technology Market Size & Forecast (USD Billion), 2021–2035 |
  88. FIGURE 15 Competitive Landscape — Laser Technology Market Revenue Share Matrix, 2025

Segmentation Quick Reference

DimensionSub-SegmentsDominant SegmentFastest Growing Segment
TechnologyCO₂ Laser, Fiber Laser, Solid-State Laser, Semiconductor & Diode Laser, OtherSemiconductor & Diode LaserFiber Laser
Power OutputLow-Power (< 1 kW), Medium-Power (1–5 kW), High-Power (5–10 kW), Ultra-High-Power (> 10 kW)Medium-Power (1–5 kW)Ultra-High-Power (> 10 kW)
ApplicationMaterial Processing, Medical & Cosmetics, Communication & Optical Storage, Automotive LiDAR, Defense & Security, OtherMaterial ProcessingAutomotive LiDAR
End-Use IndustryElectronics, Automotive, Laser Technology Market, Healthcare, Heavy Industry & Energy, OtherElectronicsHealthcare
GeographyNorth America, Europe, Asia-Pacific, South America, Middle East & AfricaAsia-PacificMiddle East & Africa


Market Segmentation Overview

By Technology

Sub-SegmentKey Trend
CO₂ LaserGradual displacement by fiber lasers in metal cutting; retains dominance in non-metal processing
Fiber LaserFastest-growing type driven by EV battery welding and automated production lines
Solid-State LaserAnchored in medical surgery and defense-directed-energy platforms
Semiconductor & Diode LaserLargest revenue segment supported by telecom, LiDAR, and 3D sensing
Other (Excimer, Gas, Dye)Niche positioning in semiconductor lithography and specialty medical applications


The technology dimension reflects a decisive shift toward solid-state and fiber architectures that offer superior efficiency and compact form factors. At the same time, CO₂ lasers retain relevance in legacy non-metal cutting and engraving applications.

By Power Output

Sub-SegmentKey Trend
Low-Power (< 1 kW)Stable demand from marking, engraving, and medical laser devices
Medium-Power (1–5 kW)Workhorse segment covering the broadest range of industrial metal processing tasks
High-Power (5–10 kW)Growing adoption in thick-plate cutting and defense applications
Ultra-High-Power (> 10 kW)Fastest-growing tier as heavy industry and defense scales to extreme power levels


Power output segmentation captures the migration from conventional mid-range systems toward ultra-high-power platforms capable of single-pass processing of thick structural materials.

By Application

Sub-SegmentKey Trend
Material ProcessingDominant application spanning cutting, welding, drilling, surface treatment, and additive manufacturing
Medical & CosmeticsRising adoption in refractive surgery, dermatology, and minimally invasive procedures
Communication & Optical StorageData-center build-outs and fiber-optic rollouts sustain stable laser transceiver demand.
Automotive LiDARFastest application growth tied to Level 3+ autonomous vehicle deployment
Defense & SecurityDirected-energy weapons and rangefinding drive government procurement cycles
Other (R&D, Entertainment)Scientific instrumentation and display technologies constitute a smaller but stable pool.


The convergence of traditional industrial demand with high-growth verticals in autonomous mobility and medical devices shapes application-level dynamics.

By End-Use Industry

Sub-SegmentKey Trend
ElectronicsLargest end-use vertical driven by semiconductor packaging and PCB micro-processing
AutomotiveEV component manufacturing and body-in-white welding fuel sustained demand.
Laser Technology MarketComposite processing and directed-energy programs provide long-cycle procurement stability.
HealthcareFastest-growing end-use industry powered by expanding reimbursement coverage for laser procedures
Heavy Industry & EnergySteel cutting, pipeline welding, and green-steel processing support steady consumption.
Other (Telecom, R&D)Fiber-optic infrastructure deployment and scientific research maintain baseline demand.


End-use segmentation highlights healthcare as the breakout growth vertical, while electronics maintains its leadership position through relentless semiconductor node transitions and advanced packaging requirements.


 

Download PDF ×

We do not share your information with anyone. However, we may send you emails based on your report interest from time to time. You may contact us at any time to opt-out.