TABLE OF CONTENTS
1. 1 EXECUTIVE SUMMARY
1.1. Market Attractiveness Analysis
1.1.1. Global Larvicides Market, by Type
1.1.2. Global Larvicides Market, by Form
1.1.3. Global Larvicides Market, by Target
1.1.4. Global Larvicides Market, by Application
1.1.5. Global Larvicides Market, by Region
2. MARKET INTRODUCTION
2.1. Definition
2.2. Scope of the Study
2.3. Market Structure
2.4. Key Buying Criteria
2.5. Macro Factor Indicator Analysis
3. RESEARCH METHODOLOGY
3.1. Research Process
3.2. Primary Research
3.3. Secondary Research
3.4. Market Size Estimation
3.5. Forecast Model
3.6. List of Assumptions
4. MARKET DYNAMICS
4.1. Introduction
4.2. Drivers
4.2.1. Driver 1
4.2.2. Driver 2
4.3. Restraints
4.3.1. Restraint 1
4.3.2. Restraint 2
4.4. Opportunities
4.4.1. Opportunity 1
4.4.2. Opportunity 2
4.5. Challenges
4.5.1. Challenge 1
4.5.2. Challenge 2
5. MARKET FACTOR ANALYSIS
5.1. Value Chain Analysis
5.2. Supply Chain Analysis
5.3. Porter’s Five Forces Model
5.3.1. Bargaining Power of Suppliers
5.3.2. Bargaining Power of Buyers
5.3.3. Threat of New Entrants
5.3.4. Threat of Substitutes
5.3.5. Intensity of Rivalry
6. GLOBAL LARVICIDES MARKET, BY TYPE
6.1. Introduction
6.2. Microbial
6.2.1. Microbial: Market Estimates & Forecast, by Region/Country, 2023–2032
6.3. Organophosphates
6.3.1. Organophosphates: Market Estimates & Forecast, by Region/Country, 2023–2032
6.4. Insect Growth Regulators
6.4.1. Insect Growth Regulators: Market Estimates & Forecast, by Region/Country, 2023–2032
6.5. Others
6.5.1. Others: Market Estimates & Forecast, by Region/Country, 2023–2032
7. GLOBAL LARVICIDES MARKET, BY FORM
7.1. Introduction
7.2. Solid
7.2.1. Solid: Market Estimates & Forecast, by Region/Country, 2023–2032
7.3. Liquid
7.3.1. Liquid: Market Estimates & Forecast, by Region/Country, 2023–2032
8. GLOBAL LARVICIDES MARKET, BY TARGET
8.1. Introduction
8.2. Mosquitoes
8.2.1. Mosquitoes: Market Estimates & Forecast, by Region/Country, 2023–2032
8.3. Flies
8.3.1. Flies: Market Estimates & Forecast, by Region/Country, 2023–2032
8.4. Others
8.4.1. Others: Market Estimates & Forecast, by Region/Country, 2023–2032
9. GLOBAL LARVICIDES MARKET, BY APPLICATION
9.1. Introduction
9.2. Agriculture
9.2.1. Agriculture: Market Estimates & Forecast, by Region/Country, 2023–2032
9.3. Non-Agriculture
9.3.1. Non-Agriculture: Market Estimates & Forecast, by Region/Country, 2023–2032
10. GLOBAL LARVICIDES MARKET, BY REGION
10.1. Introduction
10.2. North America
10.2.1. Market Estimates & Forecast, by Type, 2023–2032
10.2.2. Market Estimates & Forecast, by Form, 2023–2032
10.2.3. Market Estimates & Forecast, by Target, 2023–2032
10.2.4. Market Estimates & Forecast, by Application, 2023–2032
10.2.5. Market Estimates & Forecast, by Country, 2023–2032
10.2.6. US
10.2.6.1. Market Estimates & Forecast, by Type, 2023–2032
10.2.6.2. Market Estimates & Forecast, by Form, 2023–2032
10.2.6.3. Market Estimates & Forecast, by Target, 2023–2032
10.2.6.4. Market Estimates & Forecast, by Application, 2023–2032
10.2.7. Canada
10.2.7.1. Market Estimates & Forecast, by Type, 2023–2032
10.2.7.2. Market Estimates & Forecast, by Form, 2023–2032
10.2.7.3. Market Estimates & Forecast, by Target, 2023–2032
10.2.7.4. Market Estimates & Forecast, by Application, 2023–2032
10.2.8. Mexico
10.2.8.1. Market Estimates & Forecast, by Type, 2023–2032
10.2.8.2. Market Estimates & Forecast, by Form, 2023–2032
10.2.8.3. Market Estimates & Forecast, by Target, 2023–2032
10.2.8.4. Market Estimates & Forecast, by Application, 2023–2032
10.3. Europe
10.3.1. Market Estimates & Forecast, by Type, 2023–2032
10.3.2. Market Estimates & Forecast, by Form, 2023–2032
10.3.3. Market Estimates & Forecast, by Target, 2023–2032
10.3.4. Market Estimates & Forecast, by Application, 2023–2032
10.3.5. Market Estimates & Forecast, by Country, 2023–2032
10.3.6. Germany
10.3.6.1. Market Estimates & Forecast, by Type, 2023–2032
10.3.6.2. Market Estimates & Forecast, by Form, 2023–2032
10.3.6.3. Market Estimates & Forecast, by Target, 2023–2032
10.3.6.4. Market Estimates & Forecast, by Application, 2023–2032
10.3.7. UK
10.3.7.1. Market Estimates & Forecast, by Type, 2023–2032
10.3.7.2. Market Estimates & Forecast, by Form, 2023–2032
10.3.7.3. Market Estimates & Forecast, by Target, 2023–2032
10.3.7.4. Market Estimates & Forecast, by Application, 2023–2032
10.3.8. France
10.3.8.1. Market Estimates & Forecast, by Type, 2023–2032
10.3.8.2. Market Estimates & Forecast, by Form, 2023–2032
10.3.8.3. Market Estimates & Forecast, by Target, 2023–2032
10.3.8.4. Market Estimates & Forecast, by Application, 2023–2032
10.3.9. Spain
10.3.9.1. Market Estimates & Forecast, by Type, 2023–2032
10.3.9.2. Market Estimates & Forecast, by Form, 2023–2032
10.3.9.3. Market Estimates & Forecast, by Target, 2023–2032
10.3.9.4. Market Estimates & Forecast, by Application, 2023–2032
10.3.10. Italy
10.3.10.1. Market Estimates & Forecast, by Type, 2023–2032
10.3.10.2. Market Estimates & Forecast, by Form, 2023–2032
10.3.10.3. Market Estimates & Forecast, by Target, 2023–2032
10.3.10.4. Market Estimates & Forecast, by Application, 2023–2032
10.3.11. Rest of Europe
10.3.11.1. Market Estimates & Forecast, by Type, 2023–2032
10.3.11.2. Market Estimates & Forecast, by Form, 2023–2032
10.3.11.3. Market Estimates & Forecast, by Target, 2023–2032
10.3.11.4. Market Estimates & Forecast, by Application, 2023–2032
10.4. Asia-Pacific
10.4.1. Market Estimates & Forecast, by Type, 2023–2032
10.4.2. Market Estimates & Forecast, by Form, 2023–2032
10.4.3. Market Estimates & Forecast, by Target, 2023–2032
10.4.4. Market Estimates & Forecast, by Application, 2023–2032
10.4.5. Market Estimates & Forecast, by Country, 2023–2032
10.4.6. China
10.4.6.1. Market Estimates & Forecast, by Type, 2023–2032
10.4.6.2. Market Estimates & Forecast, by Form, 2023–2032
10.4.6.3. Market Estimates & Forecast, by Target, 2023–2032
10.4.6.4. Market Estimates & Forecast, by Application, 2023–2032
10.4.7. Japan
10.4.7.1. Market Estimates & Forecast, by Type, 2023–2032
10.4.7.2. Market Estimates & Forecast, by Form, 2023–2032
10.4.7.3. Market Estimates & Forecast, by Target, 2023–2032
10.4.7.4. Market Estimates & Forecast, by Application, 2023–2032
10.4.8. India
10.4.8.1. Market Estimates & Forecast, by Type, 2023–2032
10.4.8.2. Market Estimates & Forecast, by Form, 2023–2032
10.4.8.3. Market Estimates & Forecast, by Target, 2023–2032
10.4.8.4. Market Estimates & Forecast, by Application, 2023–2032
10.4.9. Australia & New Zealand
10.4.9.1. Market Estimates & Forecast, by Type, 2023–2032
10.4.9.2. Market Estimates & Forecast, by Form, 2023–2032
10.4.9.3. Market Estimates & Forecast, by Target, 2023–2032
10.4.9.4. Market Estimates & Forecast, by Application, 2023–2032
10.4.10. Rest of Asia-Pacific
10.4.10.1. Market Estimates & Forecast, by Type, 2023–2032
10.4.10.2. Market Estimates & Forecast, by Form, 2023–2032
10.4.10.3. Market Estimates & Forecast, by Target, 2023–2032
10.4.10.4. Market Estimates & Forecast, by Application, 2023–2032
10.5. Rest of the World
10.5.1. Market Estimates & Forecast, by Type, 2023–2032
10.5.2. Market Estimates & Forecast, by Form, 2023–2032
10.5.3. Market Estimates & Forecast, by Target, 2023–2032
10.5.4. Market Estimates & Forecast, by Application, 2023–2032
10.5.5. Market Estimates & Forecast, by Region, 2023–2032
10.5.6. South America
10.5.6.1. Market Estimates & Forecast, by Type, 2023–2032
10.5.6.2. Market Estimates & Forecast, by Form, 2023–2032
10.5.6.3. Market Estimates & Forecast, by Target, 2023–2032
10.5.6.4. Market Estimates & Forecast, by Application, 2023–2032
10.5.7. Middle East
10.5.7.1. Market Estimates & Forecast, by Type, 2023–2032
10.5.7.2. Market Estimates & Forecast, by Form, 2023–2032
10.5.7.3. Market Estimates & Forecast, by Target, 2023–2032
10.5.7.4. Market Estimates & Forecast, by Application, 2023–2032
10.5.8. Africa
10.5.8.1. Market Estimates & Forecast, by Type, 2023–2032
10.5.8.2. Market Estimates & Forecast, by Form, 2023–2032
10.5.8.3. Market Estimates & Forecast, by Target, 2023–2032
10.5.8.4. Market Estimates & Forecast, by Application, 2023–2032
11. COMPETITIVE LANDSCAPE
11.1. Introduction
11.2. Competitive Benchmarking
11.3. Development Share Analysis
11.4. Key Developments & Growth Strategies
12. COMPANY PROFILES
12.1. BASF SE
12.1.1. Company Overview
12.1.2. Financial Overview
12.1.3. Products Offered
12.1.4. Key Developments
12.1.5. SWOT Analysis
12.1.6. Key Strategies
12.2. Bayer AG
12.2.1. Company Overview
12.2.2. Financial Overview
12.2.3. Products Offered
12.2.4. Key Developments
12.2.5. SWOT Analysis
12.2.6. Key Strategies
12.3. Syngenta
12.3.1. Company Overview
12.3.2. Financial Overview
12.3.3. Products Offered
12.3.4. Key Developments
12.3.5. SWOT Analysis
12.3.6. Key Strategies
12.4. Sumitomo Chemical Co., Ltd
12.4.1. Company Overview
12.4.2. Financial Overview
12.4.3. Products Offered
12.4.4. Key Developments
12.4.5. SWOT Analysis
12.4.6. Key Strategies
12.5. ADAMA Ltd
12.5.1. Company Overview
12.5.2. Financial Overview
12.5.3. Products Offered
12.5.4. Key Developments
12.5.5. SWOT Analysis
12.5.6. Key Strategies
12.6. Certis USA LLC
12.6.1. Company Overview
12.6.2. Financial Overview
12.6.3. Products Offered
12.6.4. Key Developments
12.6.5. SWOT Analysis
12.6.6. Key Strategies
12.7. Central Garden & Pet Company
12.7.1. Company Overview
12.7.2. Financial Overview
12.7.3. Products Offered
12.7.4. Key Developments
12.7.5. SWOT Analysis
12.7.6. Key Strategies
12.8. Nufarm Limited
12.8.1. Company Overview
12.8.2. Financial Overview
12.8.3. Products Offered
12.8.4. Key Developments
12.8.5. SWOT Analysis
12.8.6. Key Strategies
12.9. Russell IPM Ltd
12.9.1. Company Overview
12.9.2. Financial Overview
12.9.3. Products Offered
12.9.4. Key Developments
12.9.5. SWOT Analysis
12.9.6. Key Strategies
12.10. Gowan Company
12.10.1. Company Overview
12.10.2. Financial Overview
12.10.3. Products Offered
12.10.4. Key Developments
12.10.5. SWOT Analysis
12.10.6. Key Strategies
12.11. Isagro
12.11.1. Company Overview
12.11.2. Financial Overview
12.11.3. Products Offered
12.11.4. Key Developments
12.11.5. SWOT Analysis
12.11.6. Key Strategies
12.12. Arysta LifeScience Corporation
12.12.1. Company Overview
12.12.2. Financial Overview
12.12.3. Products Offered
12.12.4. Key Developments
12.12.5. SWOT Analysis
12.12.6. Key Strategies
12.13. Eli Lily and Company
12.13.1. Company Overview
12.13.2. Financial Overview
12.13.3. Products Offered
12.13.4. Key Developments
12.13.5. SWOT Analysis
12.13.6. Key Strategies
13. APPENDIX
13.1. General Sources & References
13.2. List of Abbreviation
LIST OF TABLES
Table 1 Global Larvicides, by Region, 2023–2032 (USD Million)
Table 2 Global Larvicides, by Type, 2023–2032 (USD Million)
Table 3 Global Larvicides, by Form,2023–2032 (USD Million)
Table 4 Global Larvicides, by Target, 2023–2032 (USD Million)
Table 5 Global Larvicides, by Application, 2023–2032 (USD Million)
Table 6 North America: Larvicides, by Country, 2023–2032 (USD Million)
Table 7 North America: Larvicides, by Type, 2023–2032 (USD Million)
Table 8 North America: Larvicides, by Form,2023–2032 (USD Million)
Table 9 North America: Larvicides, by Target, 2023–2032 (USD Million)
Table 10 North America: Larvicides, by Application, 2023–2032 (USD Million)
Table 11 US: Larvicides, by Type, 2023–2032 (USD Million)
Table 12 US: Larvicides, by Form,2023–2032 (USD Million)
Table 13 US: Larvicides, by Target, 2023–2032 (USD Million)
Table 14 US: Larvicides, by Application, 2023–2032 (USD Million)
Table 15 Canada: Larvicides, by Type, 2023–2032 (USD Million)
Table 16 Canada: Larvicides, by Form,2023–2032 (USD Million)
Table 17 Canada: Larvicides, by Target, 2023–2032 (USD Million)
Table 18 Canada: Larvicides, by Application, 2023–2032 (USD Million)
Table 19 Mexico: Larvicides, by Type, 2023–2032 (USD Million)
Table 20 Mexico: Larvicides, by Form,2023–2032 (USD Million)
Table 21 Mexico: Larvicides, by Target, 2023–2032 (USD Million)
Table 22 Mexico: Larvicides, by Application, 2023–2032 (USD Million)
Table 23 Europe: Larvicides, by Country, 2023–2032 (USD Million)
Table 24 Europe: Larvicides, by Type, 2023–2032 (USD Million)
Table 25 Europe: Larvicides, by Form,2023–2032 (USD Million)
Table 26 Europe: Larvicides, by Target, 2023–2032 (USD Million)
Table 27 Europe: Larvicides, by Application, 2023–2032 (USD Million)
Table 28 Germany: Larvicides, by Type, 2023–2032 (USD Million)
Table 29 Germany: Larvicides, by Form,2023–2032 (USD Million)
Table 30 Germany: Larvicides, by Target, 2023–2032 (USD Million)
Table 31 Germany: Larvicides, by Application, 2023–2032 (USD Million)
Table 32 France: Larvicides, by Type, 2023–2032 (USD Million)
Table 33 France: Larvicides, by Form,2023–2032 (USD Million)
Table 34 France: Larvicides, by Target, 2023–2032 (USD Million)
Table 35 France: Larvicides, by Application, 2023–2032 (USD Million)
Table 36 Italy: Larvicides, by Type, 2023–2032 (USD Million)
Table 37 Italy: Larvicides, by Form,2023–2032 (USD Million)
Table 38 Italy: Larvicides, by Target, 2023–2032 (USD Million)
Table 39 Italy: Larvicides, by Application, 2023–2032 (USD Million)
Table 40 Spain: Larvicides, by Type, 2023–2032 (USD Million)
Table 41 Spain: Larvicides, by Form,2023–2032 (USD Million)
Table 42 Spain: Larvicides, by Target, 2023–2032 (USD Million)
Table 43 Spain: Larvicides, by Application, 2023–2032 (USD Million)
Table 44 UK: Larvicides, by Type, 2023–2032 (USD Million)
Table 45 UK: Larvicides, by Form,2023–2032 (USD Million)
Table 46 UK: Larvicides, by Target, 2023–2032 (USD Million)
Table 47 UK: Larvicides, by Application, 2023–2032 (USD Million)
Table 48 Rest of Europe: Larvicides, by Type, 2023–2032 (USD Million)
Table 49 Rest of Europe: Larvicides, by Form,2023–2032 (USD Million)
Table 50 Rest of Europe: Larvicides, by Target, 2023–2032 (USD Million)
Table 51 Rest of Europe: Larvicides, by Application, 2023–2032 (USD Million)
Table 52 Asia-Pacific: Larvicides, by Country, 2023–2032 (USD Million)
Table 53 Asia-Pacific: Larvicides, by Type, 2023–2032 (USD Million)
Table 54 Asia-Pacific: Larvicides, by Form,2023–2032 (USD Million)
Table 55 Asia-Pacific: Larvicides, by Target, 2023–2032 (USD Million)
Table 56 Asia-Pacific: Larvicides, by Application, 2023–2032 (USD Million)
Table 57 China: Larvicides, by Type, 2023–2032 (USD Million)
Table 58 China: Larvicides, by Form,2023–2032 (USD Million)
Table 59 China: Larvicides, by Target, 2023–2032 (USD Million)
Table 60 China: Larvicides, by Application, 2023–2032 (USD Million)
Table 61 India: Larvicides, by Type, 2023–2032 (USD Million)
Table 62 India: Larvicides, by Form,2023–2032 (USD Million)
Table 63 India: Larvicides, by Target, 2023–2032 (USD Million)
Table 64 India: Larvicides, by Application, 2023–2032 (USD Million)
Table 65 Japan: Larvicides, by Type, 2023–2032 (USD Million)
Table 66 Japan: Larvicides, by Form,2023–2032 (USD Million)
Table 67 Japan: Larvicides, by Target, 2023–2032 (USD Million)
Table 68 Japan: Larvicides, by Application, 2023–2032 (USD Million)
Table 69 Australia & New Zealand: Larvicides, by Type, 2023–2032 (USD Million)
Table 70 Australia & New Zealand: Larvicides, by Form,2023–2032 (USD Million)
Table 71 Australia & New Zealand: Larvicides, by Target, 2023–2032 (USD Million)
Table 72 Australia & New Zealand: Larvicides, by Application, 2023–2032 (USD Million)
Table 73 Rest of Asia-Pacific: Larvicides, by Type, 2023–2032 (USD Million)
Table 74 Rest of Asia-Pacific: Larvicides, by Form,2023–2032 (USD Million)
Table 75 Rest of Asia-Pacific: Larvicides, by Target, 2023–2032 (USD Million)
Table 76 Rest of Asia-Pacific: Larvicides, by Application, 2023–2032 (USD Million)
Table 77 Rest of the World (RoW): Larvicides, by Country, 2023–2032 (USD Million)
Table 78 Rest of the World (RoW): Larvicides, by Type, 2023–2032 (USD Million)
Table 79 Rest of the World (RoW): Larvicides, by Form,2023–2032 (USD Million)
Table 80 Rest of the World (RoW): Larvicides, by Target, 2023–2032 (USD Million)
Table 81 Rest of the World (RoW): Larvicides, by Application, 2023–2032 (USD Million)
Table 82 South America: Larvicides, by Type, 2023–2032 (USD Million)
Table 83 South America: Larvicides, by Form,2023–2032 (USD Million)
Table 84 South America: Larvicides, by Target, 2023–2032 (USD Million)
Table 85 South America: Larvicides, by Application, 2023–2032 (USD Million)
Table 86 Middle East: Larvicides, by Type, 2023–2032 (USD Million)
Table 87 Middle East: Larvicides, by Form,2023–2032 (USD Million)
Table 88 Middle East: Larvicides, by Target, 2023–2032 (USD Million)
Table 89 Middle East: Larvicides, by Application, 2023–2032 (USD Million)
Table 90 Africa: Larvicides, by Type, 2023–2032 (USD Million)
Table 91 Africa: Larvicides, by Form,2023–2032 (USD Million)
Table 92 Africa: Larvicides, by Target, 2023–2032 (USD Million)
Table 93 Africa: Larvicides, by Application, 2023–2032 (USD Million)
LIST OF FIGURES
FIGURE 1 Global 
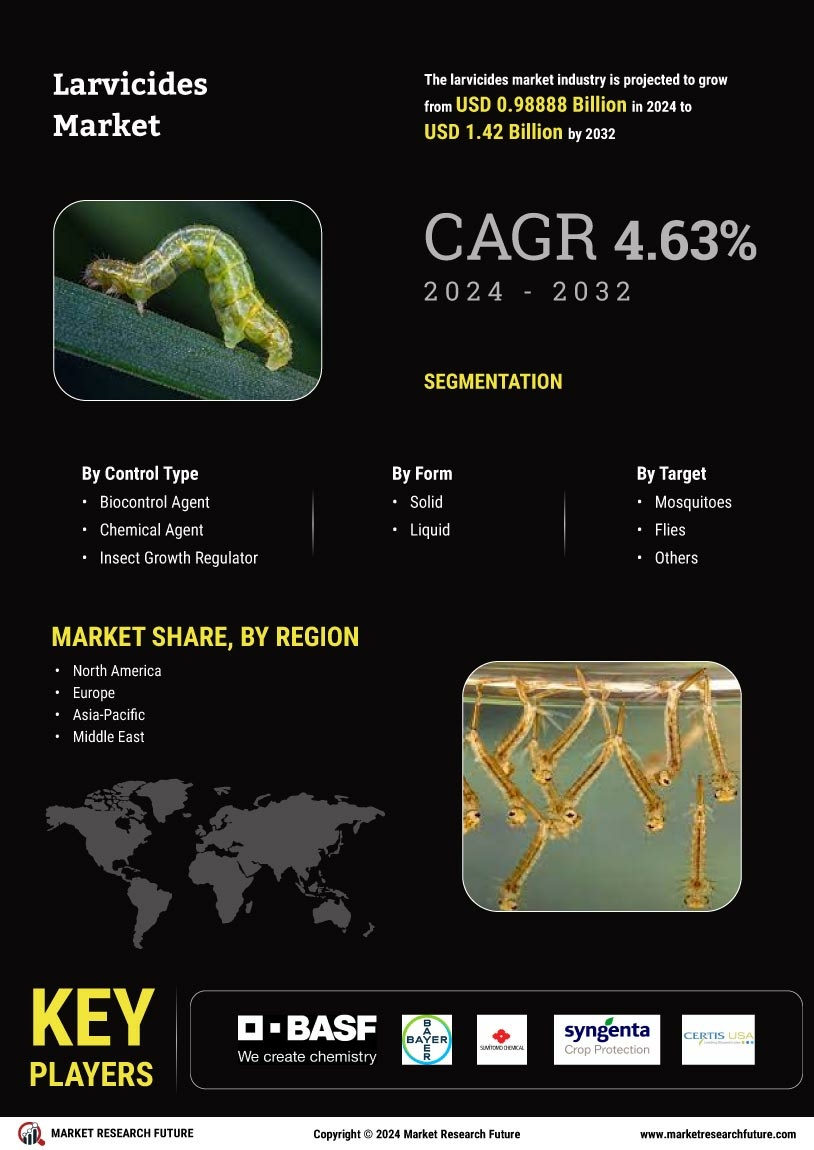
Larvicides Market Segmentation
FIGURE 2 Forecast Research Methodology
FIGURE 3 Five Forces Analysis of the Global Larvicides Market
FIGURE 4 Value Chain of the Global Larvicides Market
FIGURE 5 Share of the Global Larvicides Market in 2022, by Country (%)
FIGURE 6 Global Larvicides Market, by Region, 2023–2032,
FIGURE 7 Global Larvicides Market Size, by Type, 2022
FIGURE 8 Share of the Global Larvicides Market, by Type, 2023–2032 (%)
FIGURE 9 Global Larvicides Market Size, by Form, 2022
FIGURE 10 Share of the Global Larvicides Market, by Form, 2023–2032 (%)
FIGURE 9 Global Larvicides Market Size, by Target, 2022
FIGURE 10 Share of the Global Larvicides Market, by Target, 2023–2032 (%)
FIGURE 9 Global Larvicides Market Size, by Application, 2022
FIGURE 10 Share of the Global Larvicides Market, by Application, 2023–2032 (%)