Key management service Market Segmentation
Key management service Market By Application (USD Billion, 2025-2035)
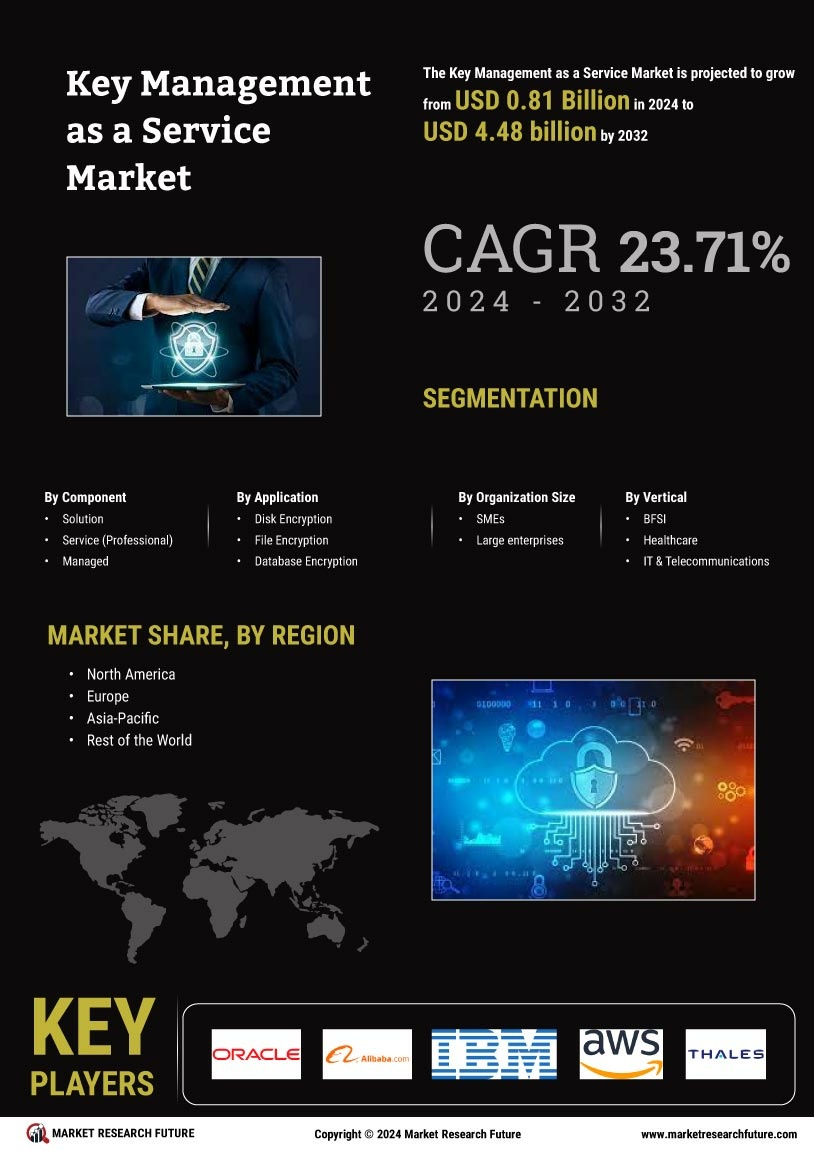
- Disk Encryption
- File Encryption
- Database Encryption
- Communication Encryption
- Key management service Market Encryption
Key management service Market By Component (USD Billion, 2025-2035)
- Solution
- Service
- Managed
Key management service Market By Organization Size (USD Billion, 2025-2035)
- SMEs
- Large Enterprises
Key management service Market By Vertical (USD Billion, 2025-2035)
- BFSI
- Healthcare
- IT & Telecommunications
- Government
- Retail
- Manufacturing
- Aerospace & Defense