Japan Time Sensitive Networking Market Segmentation
Japan Time Sensitive Networking Market By Application (USD Million, 2025-2035)
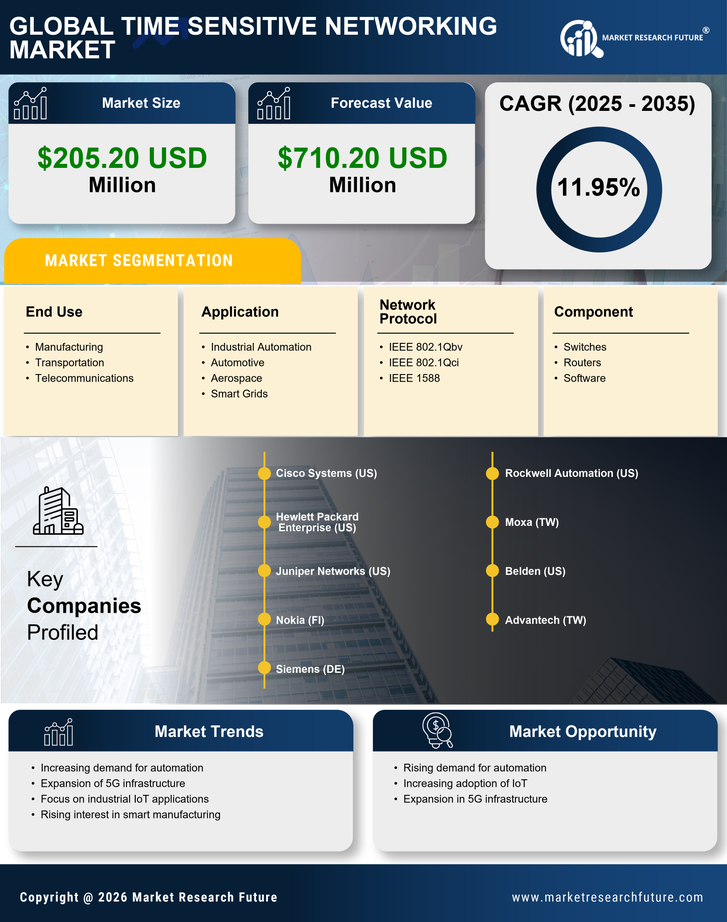
- Industrial Automation
- Automotive
- Aerospace
- Smart Grids
Japan Time Sensitive Networking Market By Network Protocol (USD Million, 2025-2035)
- IEEE 802.1Qbv
- IEEE 802.1Qci
- IEEE 1588
Japan Time Sensitive Networking Market By End Use (USD Million, 2025-2035)
- Manufacturing
- Transportation
- Telecommunications
Japan Time Sensitive Networking Market By Component (USD Million, 2025-2035)
- Switches
- Routers
- Japan Time Sensitive Networking Market