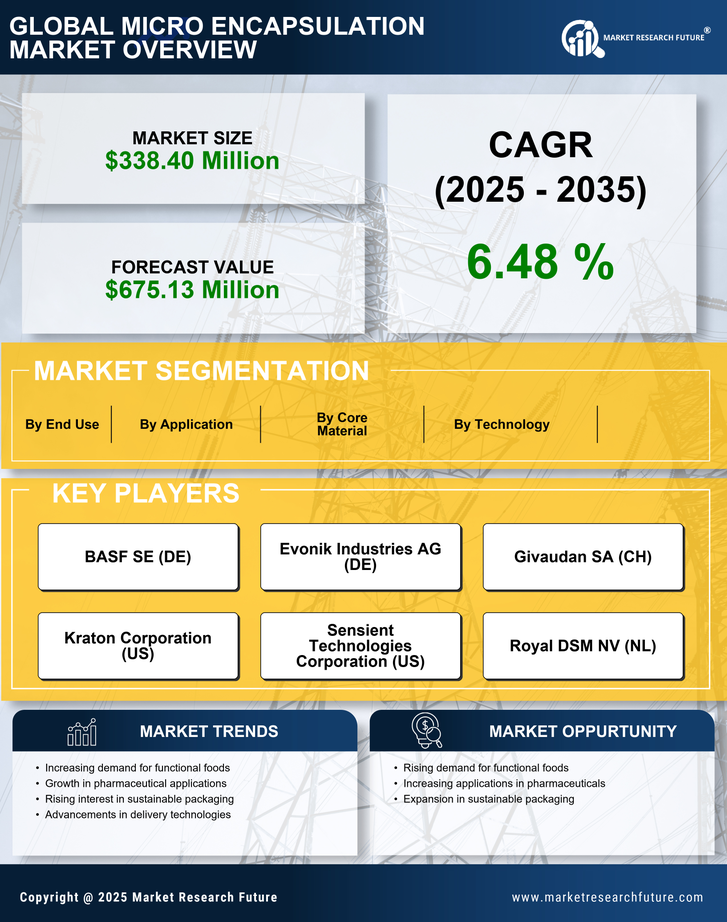
Request Free Sample ×

Kindly complete the form below to receive a free sample of this Report

* Please use a valid business email

Leading companies partner with us for data-driven Insights

clients tt-cursor
Hero Background

Japan Micro Encapsulation Market

ID: MRFR/FnB/46053-HCR
200 Pages
Snehal Singh
Last Updated: April 06, 2026

Japan Microencapsulation Market Size, Share, Industry Trend & Analysis Research Report: By Technology (Spray, Emulsion, Dripping, Others), By Coating Material (Lipids, Proteins, Polymers, Gums & Resins, Carbohydrates, Others) andBy Application (Pharmaceuticals & Healthcare, Food & Beverages, Household Items, Personal Care, Agrochemicals, Others)- Forecast to 2035

Share:
Download PDF ×

We do not share your information with anyone. However, we may send you emails based on your report interest from time to time. You may contact us at any time to opt-out.

Japan Micro Encapsulation Market Infographic
Purchase Options
  1. 1 SECTION I: EXECUTIVE SUMMARY AND KEY HIGHLIGHTS
  2.   1.1 EXECUTIVE SUMMARY
  3.     1.1.1 Market Overview
  4.     1.1.2 Key Findings
  5.     1.1.3 Market Segmentation
  6.     1.1.4 Competitive Landscape
  7.     1.1.5 Challenges and Opportunities
  8.     1.1.6 Future Outlook
  9. 2 SECTION II: SCOPING, METHODOLOGY AND MARKET STRUCTURE
  10.   2.1 MARKET INTRODUCTION
  11.     2.1.1 Definition
  12.     2.1.2 Scope of the study
  13.       2.1.2.1 Research Objective
  14.       2.1.2.2 Assumption
  15.       2.1.2.3 Limitations
  16.   2.2 RESEARCH METHODOLOGY
  17.     2.2.1 Overview
  18.     2.2.2 Data Mining
  19.     2.2.3 Secondary Research
  20.     2.2.4 Primary Research
  21.       2.2.4.1 Primary Interviews and Information Gathering Process
  22.       2.2.4.2 Breakdown of Primary Respondents
  23.     2.2.5 Forecasting Model
  24.     2.2.6 Market Size Estimation
  25.       2.2.6.1 Bottom-Up Approach
  26.       2.2.6.2 Top-Down Approach
  27.     2.2.7 Data Triangulation
  28.     2.2.8 Validation
  29. 3 SECTION III: QUALITATIVE ANALYSIS
  30.   3.1 MARKET DYNAMICS
  31.     3.1.1 Overview
  32.     3.1.2 Drivers
  33.     3.1.3 Restraints
  34.     3.1.4 Opportunities
  35.   3.2 MARKET FACTOR ANALYSIS
  36.     3.2.1 Value chain Analysis
  37.     3.2.2 Porter's Five Forces Analysis
  38.       3.2.2.1 Bargaining Power of Suppliers
  39.       3.2.2.2 Bargaining Power of Buyers
  40.       3.2.2.3 Threat of New Entrants
  41.       3.2.2.4 Threat of Substitutes
  42.       3.2.2.5 Intensity of Rivalry
  43.     3.2.3 COVID-19 Impact Analysis
  44.       3.2.3.1 Market Impact Analysis
  45.       3.2.3.2 Regional Impact
  46.       3.2.3.3 Opportunity and Threat Analysis
  47. 4 SECTION IV: QUANTITATIVE ANALYSIS
  48.   4.1 Pharmaceutical, BY Application (USD Million)
  49.     4.1.1 Pharmaceuticals
  50.     4.1.2 Food and Beverage
  51.     4.1.3 Agriculture
  52.     4.1.4 Cosmetics
  53.     4.1.5 Nutraceuticals
  54.   4.2 Pharmaceutical, BY Technology (USD Million)
  55.     4.2.1 Spray Drying
  56.     4.2.2 Fluid Bed Coating
  57.     4.2.3 Emulsion Deposition
  58.     4.2.4 Pan Coating
  59.     4.2.5 Coacervation
  60.   4.3 Pharmaceutical, BY Core Material (USD Million)
  61.     4.3.1 Polymers
  62.     4.3.2 Carbohydrates
  63.     4.3.3 Lipids
  64.     4.3.4 Proteins
  65.     4.3.5 Inorganic Compounds
  66.   4.4 Pharmaceutical, BY End Use (USD Million)
  67.     4.4.1 Consumer Goods
  68.     4.4.2 Industrial
  69.     4.4.3 Healthcare
  70.     4.4.4 Food Production
  71. 5 SECTION V: COMPETITIVE ANALYSIS
  72.   5.1 Competitive Landscape
  73.     5.1.1 Overview
  74.     5.1.2 Competitive Analysis
  75.     5.1.3 Market share Analysis
  76.     5.1.4 Major Growth Strategy in the Pharmaceutical
  77.     5.1.5 Competitive Benchmarking
  78.     5.1.6 Leading Players in Terms of Number of Developments in the Pharmaceutical
  79.     5.1.7 Key developments and growth strategies
  80.       5.1.7.1 New Product Launch/Service Deployment
  81.       5.1.7.2 Merger & Acquisitions
  82.       5.1.7.3 Joint Ventures
  83.     5.1.8 Major Players Financial Matrix
  84.       5.1.8.1 Sales and Operating Income
  85.       5.1.8.2 Major Players R&D Expenditure. 2023
  86.   5.2 Company Profiles
  87.     5.2.1 BASF SE (DE)
  88.       5.2.1.1 Financial Overview
  89.       5.2.1.2 Products Offered
  90.       5.2.1.3 Key Developments
  91.       5.2.1.4 SWOT Analysis
  92.       5.2.1.5 Key Strategies
  93.     5.2.2 Evonik Industries AG (DE)
  94.       5.2.2.1 Financial Overview
  95.       5.2.2.2 Products Offered
  96.       5.2.2.3 Key Developments
  97.       5.2.2.4 SWOT Analysis
  98.       5.2.2.5 Key Strategies
  99.     5.2.3 Givaudan SA (CH)
  100.       5.2.3.1 Financial Overview
  101.       5.2.3.2 Products Offered
  102.       5.2.3.3 Key Developments
  103.       5.2.3.4 SWOT Analysis
  104.       5.2.3.5 Key Strategies
  105.     5.2.4 Kraton Corporation (US)
  106.       5.2.4.1 Financial Overview
  107.       5.2.4.2 Products Offered
  108.       5.2.4.3 Key Developments
  109.       5.2.4.4 SWOT Analysis
  110.       5.2.4.5 Key Strategies
  111.     5.2.5 Sensient Technologies Corporation (US)
  112.       5.2.5.1 Financial Overview
  113.       5.2.5.2 Products Offered
  114.       5.2.5.3 Key Developments
  115.       5.2.5.4 SWOT Analysis
  116.       5.2.5.5 Key Strategies
  117.     5.2.6 Royal DSM NV (NL)
  118.       5.2.6.1 Financial Overview
  119.       5.2.6.2 Products Offered
  120.       5.2.6.3 Key Developments
  121.       5.2.6.4 SWOT Analysis
  122.       5.2.6.5 Key Strategies
  123.     5.2.7 Clariant AG (CH)
  124.       5.2.7.1 Financial Overview
  125.       5.2.7.2 Products Offered
  126.       5.2.7.3 Key Developments
  127.       5.2.7.4 SWOT Analysis
  128.       5.2.7.5 Key Strategies
  129.     5.2.8 Innospec Inc. (US)
  130.       5.2.8.1 Financial Overview
  131.       5.2.8.2 Products Offered
  132.       5.2.8.3 Key Developments
  133.       5.2.8.4 SWOT Analysis
  134.       5.2.8.5 Key Strategies
  135.     5.2.9 Encapsys LLC (US)
  136.       5.2.9.1 Financial Overview
  137.       5.2.9.2 Products Offered
  138.       5.2.9.3 Key Developments
  139.       5.2.9.4 SWOT Analysis
  140.       5.2.9.5 Key Strategies
  141.   5.3 Appendix
  142.     5.3.1 References
  143.     5.3.2 Related Reports
  144. 6 LIST OF FIGURES
  145.   6.1 MARKET SYNOPSIS
  146.   6.2 JAPAN MARKET ANALYSIS BY APPLICATION
  147.   6.3 JAPAN MARKET ANALYSIS BY TECHNOLOGY
  148.   6.4 JAPAN MARKET ANALYSIS BY CORE MATERIAL
  149.   6.5 JAPAN MARKET ANALYSIS BY END USE
  150.   6.6 KEY BUYING CRITERIA OF PHARMACEUTICAL
  151.   6.7 RESEARCH PROCESS OF MRFR
  152.   6.8 DRO ANALYSIS OF PHARMACEUTICAL
  153.   6.9 DRIVERS IMPACT ANALYSIS: PHARMACEUTICAL
  154.   6.10 RESTRAINTS IMPACT ANALYSIS: PHARMACEUTICAL
  155.   6.11 SUPPLY / VALUE CHAIN: PHARMACEUTICAL
  156.   6.12 PHARMACEUTICAL, BY APPLICATION, 2024 (% SHARE)
  157.   6.13 PHARMACEUTICAL, BY APPLICATION, 2024 TO 2035 (USD Million)
  158.   6.14 PHARMACEUTICAL, BY TECHNOLOGY, 2024 (% SHARE)
  159.   6.15 PHARMACEUTICAL, BY TECHNOLOGY, 2024 TO 2035 (USD Million)
  160.   6.16 PHARMACEUTICAL, BY CORE MATERIAL, 2024 (% SHARE)
  161.   6.17 PHARMACEUTICAL, BY CORE MATERIAL, 2024 TO 2035 (USD Million)
  162.   6.18 PHARMACEUTICAL, BY END USE, 2024 (% SHARE)
  163.   6.19 PHARMACEUTICAL, BY END USE, 2024 TO 2035 (USD Million)
  164.   6.20 BENCHMARKING OF MAJOR COMPETITORS
  165. 7 LIST OF TABLES
  166.   7.1 LIST OF ASSUMPTIONS
  167.     7.1.1
  168.   7.2 Japan MARKET SIZE ESTIMATES; FORECAST
  169.     7.2.1 BY APPLICATION, 2025-2035 (USD Million)
  170.     7.2.2 BY TECHNOLOGY, 2025-2035 (USD Million)
  171.     7.2.3 BY CORE MATERIAL, 2025-2035 (USD Million)
  172.     7.2.4 BY END USE, 2025-2035 (USD Million)
  173.   7.3 PRODUCT LAUNCH/PRODUCT DEVELOPMENT/APPROVAL
  174.     7.3.1
  175.   7.4 ACQUISITION/PARTNERSHIP
  176.     7.4.1

Japan Pharmaceutical Market Segmentation

Pharmaceutical By Application (USD Million, 2025-2035)

  • Pharmaceuticals
  • Food and Beverage
  • Agriculture
  • Cosmetics
  • Nutraceuticals

Pharmaceutical By Technology (USD Million, 2025-2035)

  • Spray Drying
  • Fluid Bed Coating
  • Emulsion Deposition
  • Pan Coating
  • Coacervation

Pharmaceutical By Core Material (USD Million, 2025-2035)

  • Polymers
  • Carbohydrates
  • Lipids
  • Proteins
  • Inorganic Compounds

Pharmaceutical By End Use (USD Million, 2025-2035)

  • Consumer Goods
  • Industrial
  • Healthcare
  • Food Production

Compare Licence

×
Features License Type
Single User Multiuser License Enterprise User
Price $4,950 $5,950 $7,250
Maximum User Access Limit 1 User Upto 10 Users Unrestricted Access Throughout the Organization
Free Customization
Direct Access to Analyst
Deliverable Format
Platform Access
Discount on Next Purchase 10% 15% 15%
Printable Versions