Japan Healthcare Predictive Analytics Market Predictive Analytics Market Segmentation
Japan Healthcare Predictive Analytics Market By Application (USD Million, 2025-2035)
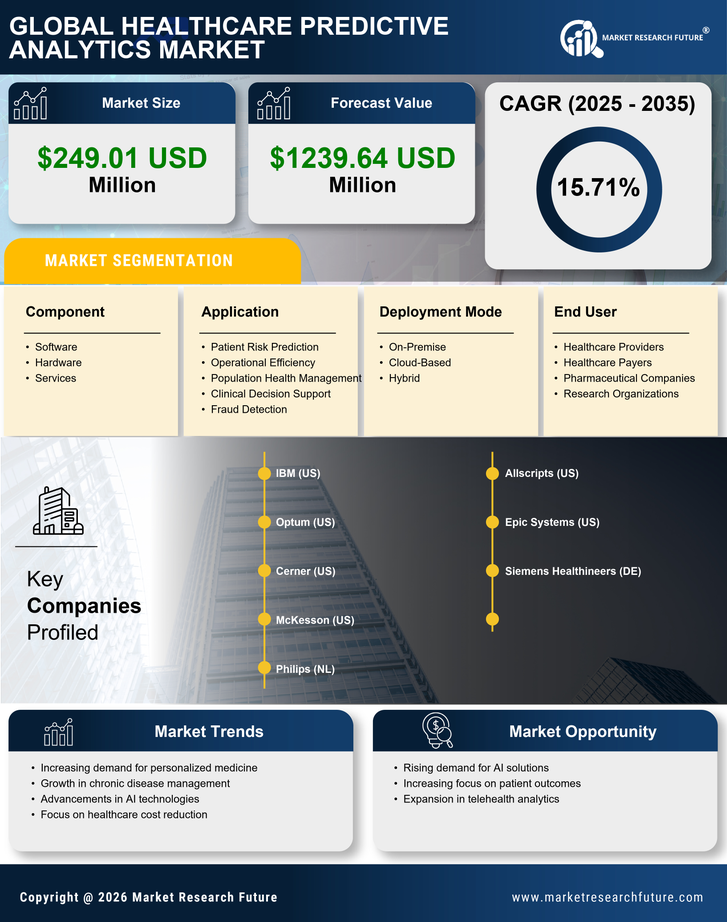
- Patient Risk Prediction
- Operational Efficiency
- Population Health Management
- Clinical Decision Support
- Fraud Detection
Japan Healthcare Predictive Analytics Market By Deployment Mode (USD Million, 2025-2035)
- On-Premise
- Cloud-Based
- Hybrid
Japan Healthcare Predictive Analytics Market By Component (USD Million, 2025-2035)
- Software
- Hardware
- Services
Japan Healthcare Predictive Analytics Market By End User (USD Million, 2025-2035)
- Japan Healthcare Predictive Analytics Market Providers
- Japan Healthcare Predictive Analytics Market Payers
- Pharmaceutical Companies
- Research Organizations