Request Free Sample ×

Kindly complete the form below to receive a free sample of this Report

* Please use a valid business email

Leading companies partner with us for data-driven Insights

clients tt-cursor
Hero Background

Japan Evtol Aircraft Market

ID: MRFR/AD/43103-HCR
200 Pages
Abbas Raut
Last Updated: April 06, 2026

Japan eVTOL Aircraft Market Size, Share, Industry Trend & Analysis Research Report: By Type (Air Taxis, Delivery Drones and others), By Battery Type (Lithium-Ion Batteries, Solid-State Batteries and Hydrogen Fuel Cells), By Lift Technology (Multirotor, Vectored Thrust, Lift Plus Cruise and other), By Type of Propulsion (Fully Electric, Hybrid, Electric Hydrogen) and By Mode of Operation (Piloted and Optionally Piloted) - Forecast to 2035.

Share:
Download PDF ×

We do not share your information with anyone. However, we may send you emails based on your report interest from time to time. You may contact us at any time to opt-out.

Japan Evtol Aircraft Market Infographic
Purchase Options
  1. 1 SECTION I: EXECUTIVE SUMMARY AND KEY HIGHLIGHTS
  2.   1.1 EXECUTIVE SUMMARY
  3.     1.1.1 Market Overview
  4.     1.1.2 Key Findings
  5.     1.1.3 Market Segmentation
  6.     1.1.4 Competitive Landscape
  7.     1.1.5 Challenges and Opportunities
  8.     1.1.6 Future Outlook
  9. 2 SECTION II: SCOPING, METHODOLOGY AND MARKET STRUCTURE
  10.   2.1 MARKET INTRODUCTION
  11.     2.1.1 Definition
  12.     2.1.2 Scope of the study
  13.       2.1.2.1 Research Objective
  14.       2.1.2.2 Assumption
  15.       2.1.2.3 Limitations
  16.   2.2 RESEARCH METHODOLOGY
  17.     2.2.1 Overview
  18.     2.2.2 Data Mining
  19.     2.2.3 Secondary Research
  20.     2.2.4 Primary Research
  21.       2.2.4.1 Primary Interviews and Information Gathering Process
  22.       2.2.4.2 Breakdown of Primary Respondents
  23.     2.2.5 Forecasting Model
  24.     2.2.6 Market Size Estimation
  25.       2.2.6.1 Bottom-Up Approach
  26.       2.2.6.2 Top-Down Approach
  27.     2.2.7 Data Triangulation
  28.     2.2.8 Validation
  29. 3 SECTION III: QUALITATIVE ANALYSIS
  30.   3.1 MARKET DYNAMICS
  31.     3.1.1 Overview
  32.     3.1.2 Drivers
  33.     3.1.3 Restraints
  34.     3.1.4 Opportunities
  35.   3.2 MARKET FACTOR ANALYSIS
  36.     3.2.1 Value chain Analysis
  37.     3.2.2 Porter's Five Forces Analysis
  38.       3.2.2.1 Bargaining Power of Suppliers
  39.       3.2.2.2 Bargaining Power of Buyers
  40.       3.2.2.3 Threat of New Entrants
  41.       3.2.2.4 Threat of Substitutes
  42.       3.2.2.5 Intensity of Rivalry
  43.     3.2.3 COVID-19 Impact Analysis
  44.       3.2.3.1 Market Impact Analysis
  45.       3.2.3.2 Regional Impact
  46.       3.2.3.3 Opportunity and Threat Analysis
  47. 4 SECTION IV: QUANTITATIVE ANALYSIS
  48.   4.1 Life Sciences, BY Type (USD Million)
  49.     4.1.1 Air Taxis
  50.     4.1.2 Delivery Drones
  51.     4.1.3 Others
  52.   4.2 Life Sciences, BY Battery Type (USD Million)
  53.     4.2.1 Lithium-Ion Batteries
  54.     4.2.2 Solid-State Batteries
  55.     4.2.3 Hydrogen Fuel Cells
  56.   4.3 Life Sciences, BY Lift Technology (USD Million)
  57.     4.3.1 Multirotor
  58.     4.3.2 Vectored Thrust
  59.     4.3.3 Lift Plus Cruise
  60.     4.3.4 Others
  61.   4.4 Life Sciences, BY Type of Propulsion (USD Million)
  62.     4.4.1 Fully Electric
  63.     4.4.2 Hybrid
  64.     4.4.3 Electric Hydrogen
  65.   4.5 Life Sciences, BY Mode of Operation (USD Million)
  66.     4.5.1 Piloted
  67.     4.5.2 Optionally Piloted
  68. 5 SECTION V: COMPETITIVE ANALYSIS
  69.   5.1 Competitive Landscape
  70.     5.1.1 Overview
  71.     5.1.2 Competitive Analysis
  72.     5.1.3 Market share Analysis
  73.     5.1.4 Major Growth Strategy in the Life Sciences
  74.     5.1.5 Competitive Benchmarking
  75.     5.1.6 Leading Players in Terms of Number of Developments in the Life Sciences
  76.     5.1.7 Key developments and growth strategies
  77.       5.1.7.1 New Product Launch/Service Deployment
  78.       5.1.7.2 Merger & Acquisitions
  79.       5.1.7.3 Joint Ventures
  80.     5.1.8 Major Players Financial Matrix
  81.       5.1.8.1 Sales and Operating Income
  82.       5.1.8.2 Major Players R&D Expenditure. 2023
  83.   5.2 Company Profiles
  84.     5.2.1 Joby Aviation (US)
  85.       5.2.1.1 Financial Overview
  86.       5.2.1.2 Products Offered
  87.       5.2.1.3 Key Developments
  88.       5.2.1.4 SWOT Analysis
  89.       5.2.1.5 Key Strategies
  90.     5.2.2 Volocopter (DE)
  91.       5.2.2.1 Financial Overview
  92.       5.2.2.2 Products Offered
  93.       5.2.2.3 Key Developments
  94.       5.2.2.4 SWOT Analysis
  95.       5.2.2.5 Key Strategies
  96.     5.2.3 Lilium (DE)
  97.       5.2.3.1 Financial Overview
  98.       5.2.3.2 Products Offered
  99.       5.2.3.3 Key Developments
  100.       5.2.3.4 SWOT Analysis
  101.       5.2.3.5 Key Strategies
  102.     5.2.4 Archer Aviation (US)
  103.       5.2.4.1 Financial Overview
  104.       5.2.4.2 Products Offered
  105.       5.2.4.3 Key Developments
  106.       5.2.4.4 SWOT Analysis
  107.       5.2.4.5 Key Strategies
  108.     5.2.5 Boeing (US)
  109.       5.2.5.1 Financial Overview
  110.       5.2.5.2 Products Offered
  111.       5.2.5.3 Key Developments
  112.       5.2.5.4 SWOT Analysis
  113.       5.2.5.5 Key Strategies
  114.     5.2.6 Airbus (FR)
  115.       5.2.6.1 Financial Overview
  116.       5.2.6.2 Products Offered
  117.       5.2.6.3 Key Developments
  118.       5.2.6.4 SWOT Analysis
  119.       5.2.6.5 Key Strategies
  120.     5.2.7 Bell Textron (US)
  121.       5.2.7.1 Financial Overview
  122.       5.2.7.2 Products Offered
  123.       5.2.7.3 Key Developments
  124.       5.2.7.4 SWOT Analysis
  125.       5.2.7.5 Key Strategies
  126.     5.2.8 Hyundai (KR)
  127.       5.2.8.1 Financial Overview
  128.       5.2.8.2 Products Offered
  129.       5.2.8.3 Key Developments
  130.       5.2.8.4 SWOT Analysis
  131.       5.2.8.5 Key Strategies
  132.     5.2.9 Kitty Hawk (US)
  133.       5.2.9.1 Financial Overview
  134.       5.2.9.2 Products Offered
  135.       5.2.9.3 Key Developments
  136.       5.2.9.4 SWOT Analysis
  137.       5.2.9.5 Key Strategies
  138.   5.3 Appendix
  139.     5.3.1 References
  140.     5.3.2 Related Reports
  141. 6 LIST OF FIGURES
  142.   6.1 MARKET SYNOPSIS
  143.   6.2 JAPAN MARKET ANALYSIS BY TYPE
  144.   6.3 JAPAN MARKET ANALYSIS BY BATTERY TYPE
  145.   6.4 JAPAN MARKET ANALYSIS BY LIFT TECHNOLOGY
  146.   6.5 JAPAN MARKET ANALYSIS BY TYPE OF PROPULSION
  147.   6.6 JAPAN MARKET ANALYSIS BY MODE OF OPERATION
  148.   6.7 KEY BUYING CRITERIA OF LIFE SCIENCES
  149.   6.8 RESEARCH PROCESS OF MRFR
  150.   6.9 DRO ANALYSIS OF LIFE SCIENCES
  151.   6.10 DRIVERS IMPACT ANALYSIS: LIFE SCIENCES
  152.   6.11 RESTRAINTS IMPACT ANALYSIS: LIFE SCIENCES
  153.   6.12 SUPPLY / VALUE CHAIN: LIFE SCIENCES
  154.   6.13 LIFE SCIENCES, BY TYPE, 2024 (% SHARE)
  155.   6.14 LIFE SCIENCES, BY TYPE, 2024 TO 2035 (USD Million)
  156.   6.15 LIFE SCIENCES, BY BATTERY TYPE, 2024 (% SHARE)
  157.   6.16 LIFE SCIENCES, BY BATTERY TYPE, 2024 TO 2035 (USD Million)
  158.   6.17 LIFE SCIENCES, BY LIFT TECHNOLOGY, 2024 (% SHARE)
  159.   6.18 LIFE SCIENCES, BY LIFT TECHNOLOGY, 2024 TO 2035 (USD Million)
  160.   6.19 LIFE SCIENCES, BY TYPE OF PROPULSION, 2024 (% SHARE)
  161.   6.20 LIFE SCIENCES, BY TYPE OF PROPULSION, 2024 TO 2035 (USD Million)
  162.   6.21 LIFE SCIENCES, BY MODE OF OPERATION, 2024 (% SHARE)
  163.   6.22 LIFE SCIENCES, BY MODE OF OPERATION, 2024 TO 2035 (USD Million)
  164.   6.23 BENCHMARKING OF MAJOR COMPETITORS
  165. 7 LIST OF TABLES
  166.   7.1 LIST OF ASSUMPTIONS
  167.     7.1.1
  168.   7.2 Japan MARKET SIZE ESTIMATES; FORECAST
  169.     7.2.1 BY TYPE, 2025-2035 (USD Million)
  170.     7.2.2 BY BATTERY TYPE, 2025-2035 (USD Million)
  171.     7.2.3 BY LIFT TECHNOLOGY, 2025-2035 (USD Million)
  172.     7.2.4 BY TYPE OF PROPULSION, 2025-2035 (USD Million)
  173.     7.2.5 BY MODE OF OPERATION, 2025-2035 (USD Million)
  174.   7.3 PRODUCT LAUNCH/PRODUCT DEVELOPMENT/APPROVAL
  175.     7.3.1
  176.   7.4 ACQUISITION/PARTNERSHIP
  177.     7.4.1

Japan Life Sciences Market Segmentation

Life Sciences By Type (USD Million, 2025-2035)
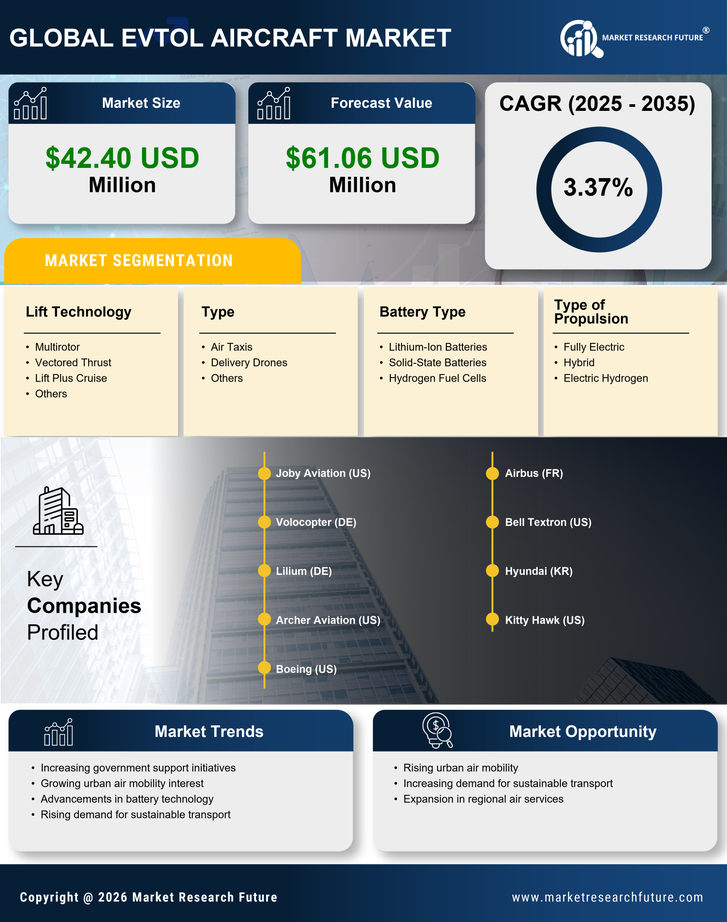
  • Air Taxis
  • Delivery Drones
  • Others

Life Sciences By Battery Type (USD Million, 2025-2035)

  • Lithium-Ion Batteries
  • Solid-State Batteries
  • Hydrogen Fuel Cells

Life Sciences By Lift Technology (USD Million, 2025-2035)

  • Multirotor
  • Vectored Thrust
  • Lift Plus Cruise
  • Others

Life Sciences By Type of Propulsion (USD Million, 2025-2035)

  • Fully Electric
  • Hybrid
  • Electric Hydrogen

Life Sciences By Mode of Operation (USD Million, 2025-2035)

  • Piloted
  • Optionally Piloted

Compare Licence

×
Features License Type
Single User Multiuser License Enterprise User
Price $4,950 $5,950 $7,250
Maximum User Access Limit 1 User Upto 10 Users Unrestricted Access Throughout the Organization
Free Customization
Direct Access to Analyst
Deliverable Format
Platform Access
Discount on Next Purchase 10% 15% 15%
Printable Versions