Japan Japan Automotive Aftermarket Industry Market Segmentation
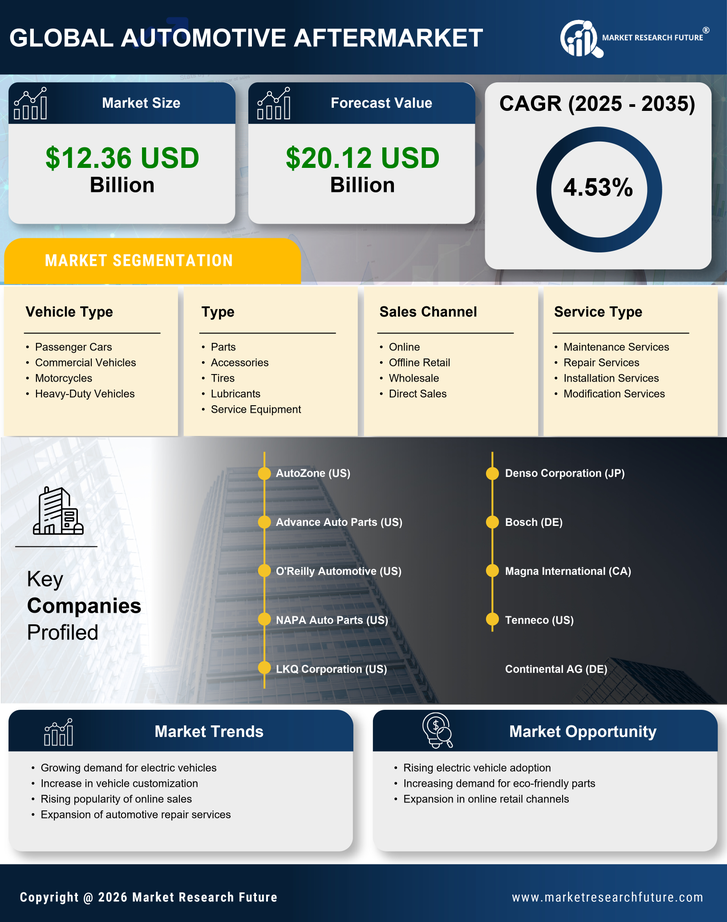
Japan Automotive Aftermarket Industry By Type (USD Billion, 2025-2035)
- Parts
- Accessories
- Tires
- Lubricants
- Service Equipment
Japan Automotive Aftermarket Industry By Sales Channel (USD Billion, 2025-2035)
- Online
- Offline Retail
- Wholesale
- Direct Sales
Japan Automotive Aftermarket Industry By Vehicle Type (USD Billion, 2025-2035)
- Passenger Cars
- Commercial Vehicles
- Motorcycles
- Heavy-Duty Vehicles
Japan Automotive Aftermarket Industry By Service Type (USD Billion, 2025-2035)
- Maintenance Services
- Repair Services
- Installation Services
- Modification Services