Japan Japan Agile IoT Market Segmentation
Japan Agile IoT Market By Component (USD Million, 2025-2035)
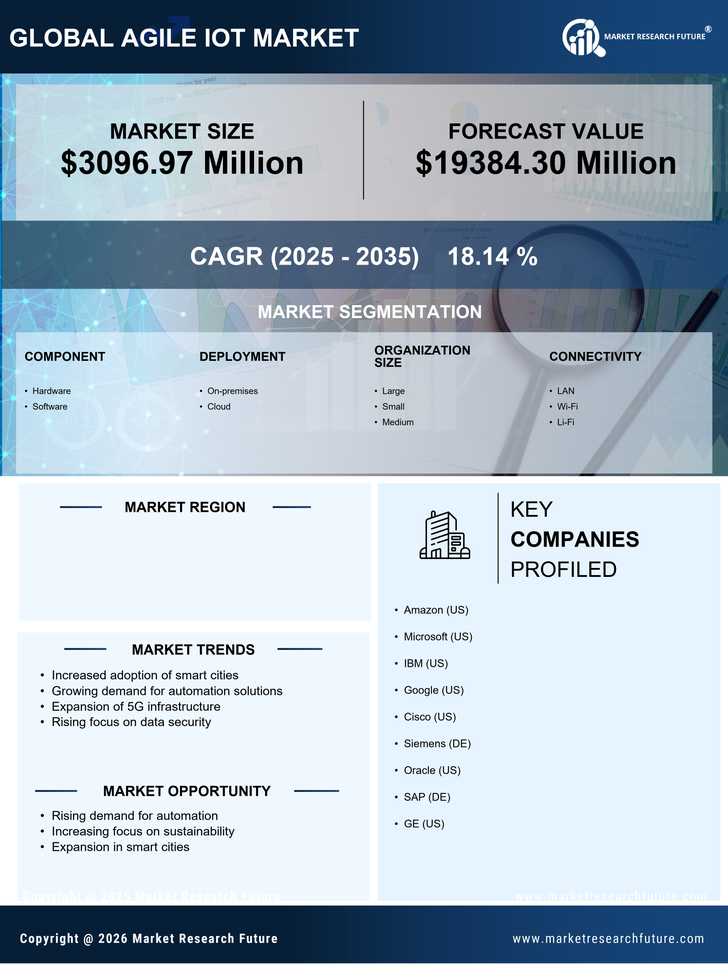
- Hardware
- Software
Japan Agile IoT Market By Deployment (USD Million, 2025-2035)
- On-premises
- Cloud
Japan Agile IoT Market By Organization Size (USD Million, 2025-2035)
- Large
- Small
- Medium
Japan Agile IoT Market By Connectivity (USD Million, 2025-2035)
- LAN
- Wi-Fi
- Li-Fi
Japan Agile IoT Market By Vertical (USD Million, 2025-2035)
- Manufacturing
- Healthcare