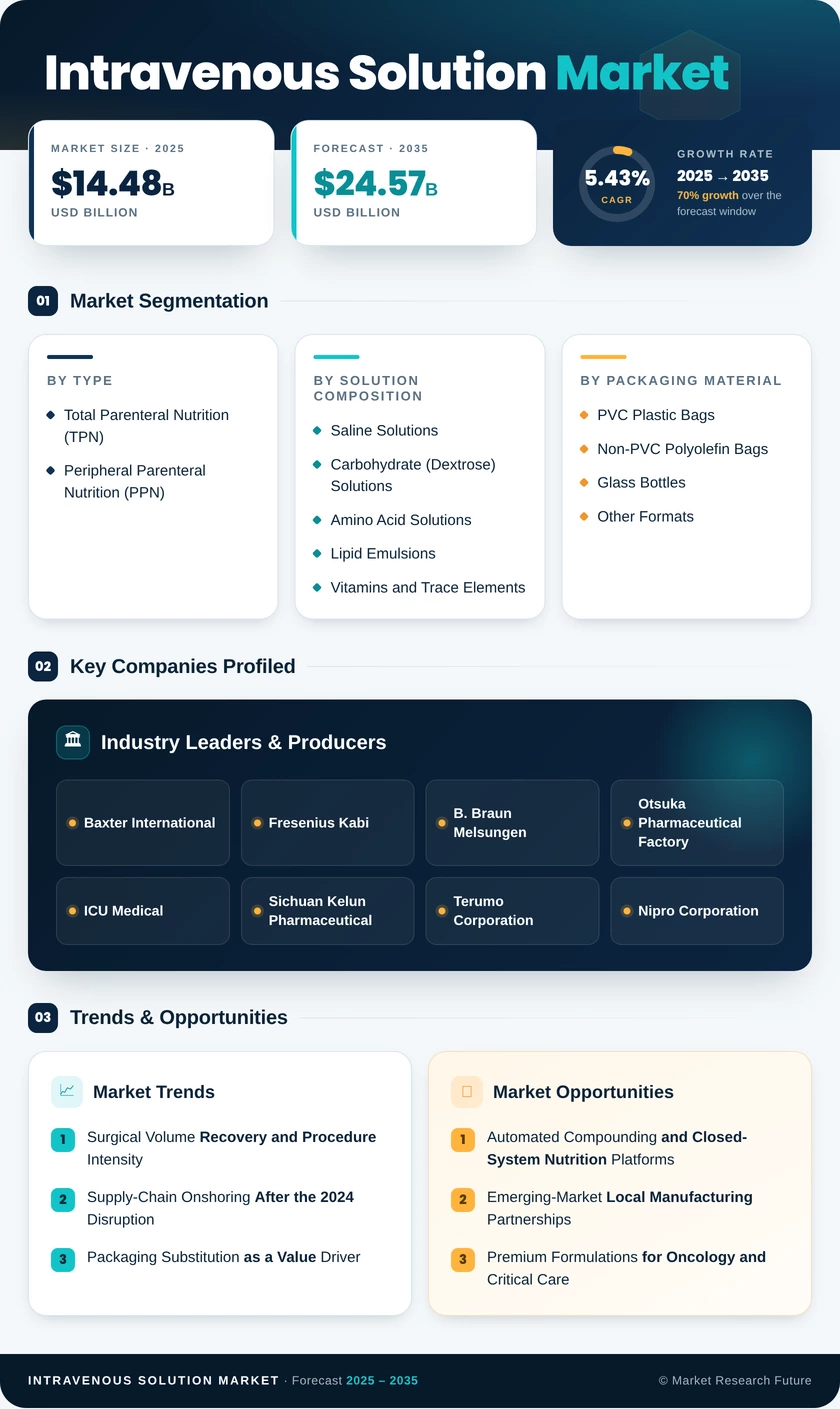
Intravenous Solution Market (2026 - 2035)

Intravenous solution market Research Report Information By Nutrition Type (Peripheral Parenteral Nutrition and Total Parenteral Nutrition), By Bag Type (Large Volume Bags (>250 ml) and Small Volume Bags (<250 ml)), By Nutritional Content (Amino Acid Solution, Carbohydrates, Vitamins & Minerals, Parenteral Lipid Emulsion, and Others), By End User (Hospital & Clinics, Ambulatory Surgical Centers, and Home Care), And By Region (North America, Europe, Asia-Pacific, And Rest Of The World) - Growth & Industry Forecast 2025 To 2035

Forecast Period
2026-2035
CAGR
5.43%
2025 Market Size
USD 14.48 Billion
2035 Market Size
USD 24.57 Billion
Healthcare ● Updated August 24, 2026 Report ID: MRFR/HC/0727-CR | Pages: 124 | Author: Nidhi Mandole, Rahul Gotadki
  1. 1 Market Overview |
    1. 1.1 Study Assumptions & Market Definition |
    2. 1.2 Scope of the Study |
    3. 1.3 Research Methodology
  2. 2 Market Summary & Key Report Takeaways |
    1. 2.1 Takeaways by Type |
    2. 2.2 Takeaways by Solution Composition & Packaging Material |
    3. 2.3 Takeaways by End User & Geography
  3. 3 Global Market Size & Forecast (2021–2035) |
    1. 3.1 Historical Market Size (2021–2024) |
    2. 3.2 Base Year Assessment (2025) |
    3. 3.3 Forecast Market Size (2026–2035) |
    4. 3.4 Year-over-Year Growth Analysis
  4. 4 Market Dynamics — Driver Impact Analysis |
    1. 4.1 Surgical Volume Recovery & Procedure Intensity |
    2. 4.2 Supply-Chain Onshoring & Capacity Reshoring |
    3. 4.3 Packaging Substitution as a Value Driver |
    4. 4.4 Home Infusion & Care-Setting Migration
  5. 5 Market Dynamics — Restraints Impact Analysis |
    1. 5.1 Price Compression in a Commoditised Category |
    2. 5.2 Fluid Stewardship & Enteral-First Protocols |
    3. 5.3 Conversion Capital & Validation Timelines
  6. 6 Market Opportunity Analysis |
    1. 6.1 Automated Compounding & Closed-System Nutrition Platforms |
    2. 6.2 Emerging-Market Local Manufacturing Partnerships |
    3. 6.3 Premium Formulations for Oncology & Critical Care |
    4. 6.4 Infusion Data Monetisation & Managed-Service Models |
    5. 6.5 Resilience-as-a-Service Supply Contracts |
    6. 6.6 Industry Value Chain Analysis |
    7. 6.7 Porter's Five Forces Analysis
  7. 7 Regional Market Share & Country-Level Analysis |
    1. 7.1 North America | |
      1. 7.1.1 US | |
      2. 7.1.2 Canada | |
      3. 7.1.3 Mexico |
    2. 7.2 Europe | |
      1. 7.2.1 Germany | |
      2. 7.2.2 UK | |
      3. 7.2.3 France | |
      4. 7.2.4 Italy | |
      5. 7.2.5 Spain | |
      6. 7.2.6 Nordic Countries | |
      7. 7.2.7 Russia | |
      8. 7.2.8 Rest of Europe |
    3. 7.3 Asia-Pacific | |
      1. 7.3.1 China | |
      2. 7.3.2 India | |
      3. 7.3.3 Japan | |
      4. 7.3.4 South Korea | |
      5. 7.3.5 ASEAN | |
      6. 7.3.6 Rest of Asia-Pacific |
    4. 7.4 South America | |
      1. 7.4.1 Brazil | |
      2. 7.4.2 Argentina | |
      3. 7.4.3 Rest of South America |
    5. 7.5 Middle East & Africa | |
      1. 7.5.1 Saudi Arabia | |
      2. 7.5.2 UAE | |
      3. 7.5.3 South Africa | |
      4. 7.5.4 Egypt | |
      5. 7.5.5 Rest of Middle East & Africa
  8. 8 Future Outlook (2026–2035) |
    1. 8.1 Clinical Decision Support as Standard Infrastructure |
    2. 8.2 Sustainability Reporting & Packaging Carbon Disclosure |
    3. 8.3 Nutrition Personalisation & Automated Compounding |
    4. 8.4 Preparedness Funding & Capacity Economics
  9. 9 Market Segmentation Analysis |
    1. 9.1 By Type | |
      1. 9.1.1 Total Parenteral Nutrition (TPN) | |
      2. 9.1.2 Peripheral Parenteral Nutrition (PPN) |
    2. 9.2 By Solution Composition | |
      1. 9.2.1 Saline Solutions | |
      2. 9.2.2 Carbohydrate (Dextrose) Solutions | |
      3. 9.2.3 Amino Acid Solutions | |
      4. 9.2.4 Lipid Emulsions | |
      5. 9.2.5 Vitamins & Trace Elements |
    3. 9.3 By Packaging Material | |
      1. 9.3.1 Glass Bottles | |
      2. 9.3.2 PVC Plastic Bags | |
      3. 9.3.3 Non-PVC Polyolefin Bags | |
      4. 9.3.4 Other Formats |
    4. 9.4 By End User | |
      1. 9.4.1 Hospitals & Clinics | |
      2. 9.4.2 Ambulatory Surgical Centres | |
      3. 9.4.3 Home-Care Settings | |
      4. 9.4.4 Long-Term Care & Others
  10. 10 Competitive Landscape |
    1. 10.1 Market Concentration Analysis (2026) |
    2. 10.2 Competitive Benchmarking Matrix |
    3. 10.3 Company Profiles | |
      1. 10.3.1 Baxter International | |
      2. 10.3.2 Fresenius Kabi | |
      3. 10.3.3 B. Braun Melsungen | |
      4. 10.3.4 Otsuka Pharmaceutical Factory | |
      5. 10.3.5 ICU Medical | |
      6. 10.3.6 Sichuan Kelun Pharmaceutical | |
      7. 10.3.7 Terumo Corporation | |
      8. 10.3.8 Nipro Corporation | |
      9. 10.3.9 Grifols | |
      10. 10.3.10 Pfizer (Hospira) | |
      11. 10.3.11 Amanta Healthcare | |
      12. 10.3.12 JW Life Science
  11. 11 Recent News & Developments
  12. 12 Report Scope & Methodology |
    1. 12.1 Study Period & Base Year |
    2. 12.2 Data Sources & Estimation Framework |
    3. 12.3 Abbreviations
  13. 13 Detailed Sources & Citations
  14. 14 Frequently Asked Questions
  15. 15 LIST OF TABLES |
  16. TABLE 1 Global Intravenous Solution Market Size & Forecast, by Revenue (USD Billion), 2021–2035 |
  17. TABLE 2 Global Intravenous Solution Market — Year-over-Year Growth Analysis, 2021–2035 |
  18. TABLE 3 Driver Impact Analysis Matrix, 2026–2035 |
  19. TABLE 4 Restraint Impact Analysis Matrix, 2026–2035 |
  20. TABLE 5 Global Market Size, by Region, 2021–2035 (USD Billion) |
  21. TABLE 6 North America Market Size, by Country, 2021–2035 (USD Billion) |
  22. TABLE 7 Europe Market Size, by Country, 2021–2035 (USD Billion) |
  23. TABLE 8 Asia-Pacific Market Size, by Country, 2021–2035 (USD Billion) |
  24. TABLE 9 South America Market Size, by Country, 2021–2035 (USD Billion) |
  25. TABLE 10 Middle East & Africa Market Size, by Country, 2021–2035 (USD Billion) |
  26. TABLE 11 Global Market Size, by Type, 2021–2035 (USD Billion) |
  27. TABLE 12 Global Market Size, by Solution Composition, 2021–2035 (USD Billion) |
  28. TABLE 13 Global Market Size, by Packaging Material, 2021–2035 (USD Billion) |
  29. TABLE 14 Global Market Size, by End User, 2021–2035 (USD Billion) |
  30. TABLE 15 North America Market Size, by Type & Solution Composition, 2021–2035 (USD Billion) |
  31. TABLE 16 Europe Market Size, by Packaging Material & End User, 2021–2035 (USD Billion) |
  32. TABLE 17 Asia-Pacific Market Size, by Type & End User, 2021–2035 (USD Billion) |
  33. TABLE 18 South America Market Size, by Solution Composition, 2021–2035 (USD Billion) |
  34. TABLE 19 Middle East & Africa Market Size, by End User, 2021–2035 (USD Billion) |
  35. TABLE 20 Competitive Benchmarking Matrix, 2026 |
  36. TABLE 21 Company Profiles — Key Players |
  37. TABLE 22 Recent Developments & Strategic Announcements, 2023–2025 |
  38. TABLE 23 Report Scope & Methodology Summary |
  39. TABLE 24 Detailed Sources & Citations Index
  40. 16 LIST OF FIGURES |
  41. FIGURE 1 Market Dynamics — Drivers, Restraints & Opportunities Overview |
  42. FIGURE 2 Industry Value Chain Analysis |
  43. FIGURE 3 Porter's Five Forces Analysis |
  44. FIGURE 4 Global Market Size Trend & Forecast (2021–2035) |
  45. FIGURE 5 Year-over-Year Growth Curve (2022–2035) |
  46. FIGURE 6 Market Share by Type, 2025 vs 2035 |
  47. FIGURE 7 Market Share by Solution Composition, 2025 |
  48. FIGURE 8 Market Share by Packaging Material, 2025 vs 2035 |
  49. FIGURE 9 Market Share by End User, 2025 |
  50. FIGURE 10 Regional Revenue Share Distribution, 2025 |
  51. FIGURE 11 Regional CAGR Comparison, 2026–2035 |
  52. FIGURE 12 Country-Level Growth Heat Map |
  53. FIGURE 13 Competitive Landscape — Revenue Share Positioning, 2026 |
  54. FIGURE 14 Strategic Positioning Matrix — Scale vs Specialisation |
  55. FIGURE 15 Packaging Transition Timeline by Region

Segmentation Quick Reference

DimensionSub-SegmentsDominant SegmentFastest Growing Segment
By TypeTotal Parenteral Nutrition, Peripheral Parenteral NutritionTotal Parenteral NutritionPeripheral Parenteral Nutrition
By Solution CompositionSaline Solutions, Carbohydrate (Dextrose) Solutions, Amino Acid Solutions, Lipid Emulsions, Vitamins & Trace ElementsSaline SolutionsLipid Emulsions
By Packaging MaterialGlass Bottles, PVC Plastic Bags, Non-PVC Polyolefin Bags, Other FormatsPVC Plastic BagsNon-PVC Polyolefin Bags
By End UserHospitals & Clinics, Ambulatory Surgical Centres, Home-Care Settings, Long-Term Care & OthersHospitals & ClinicsHome-Care Settings
By RegionNorth America, Europe, Asia-Pacific, South America, Middle East & AfricaNorth AmericaAsia-Pacific


Market Segmentation Overview

By Type

Sub-SegmentKey Trend
Total Parenteral NutritionMulti-chamber standardised bags cede ground to automated individualised admixtures in tertiary centres.
Peripheral Parenteral NutritionEarlier nutritional intervention protocols widen eligibility in general wards and step-down units.


Type segmentation captures the clearest tension in the Intravenous Solution Market: revenue concentration in critical care against volume growth in shorter, lower-acuity courses. Suppliers holding both presentations under one clinical relationship convert ward patients into long-stay nutrition customers without competitive re-tendering.

By Solution Composition

Sub-SegmentKey Trend
Saline SolutionsPrice-anchored commodity; balanced crystalloid substitution reshuffles mix without expanding volume
Carbohydrate (Dextrose) SolutionsSteady demand tied to caloric support and glycaemic management protocols
Amino Acid SolutionsHigher-concentration presentations reduce fluid load in restrictive-volume patients.
Lipid EmulsionsFish-oil and olive-oil blends displace soybean-only formulations on hepatic safety evidence.
Vitamins & Trace ElementsMicronutrient shortages drive supply diversification and multi-source qualification.


Composition determines margin more decisively than any other dimension. Crystalloids fund the factory; nutrition components fund the research pipeline.

By Packaging Material

Sub-SegmentKey Trend
Glass BottlesRetained for lipid and photolabile formulations despite weight and breakage penalties
PVC Plastic BagsDeclining share as phthalate justification requirements tighten in Europe and North America.
Non-PVC Polyolefin BagsFastest structural shift; multilayer film capacity becomes a competitive bottleneck.
Other FormatsSemi-rigid and specialty presentations serve niche compatibility requirements.


Packaging is where regulation translates directly into capital expenditure. Film extrusion capacity, not filling capacity, is the constraint that will decide which suppliers complete the transition on schedule.

By End User

Sub-SegmentKey Trend
Hospitals & ClinicsConsolidated tender purchasing with rising weight on supply-resilience guarantees
Ambulatory Surgical CentresLower per-case fluid spend but rapidly expanding procedure share.
Home-Care SettingsSpecialty pharmacy channel economics reward patient-handling design and training support
Long-Term Care & OthersAgeing residential populations sustain baseline nutrition and hydration demand.


End-user mix increasingly determines route-to-market strategy. Tender expertise wins hospitals; pharmacy network partnerships win everything downstream of them.

By Region

Sub-SegmentKey Trend
North AmericaRedundancy contracting and reshored capacity reset supplier evaluation criteria
EuropePhthalate restrictions and carbon disclosure make compliance a tender qualifier.
Asia-PacificBed expansion and local-content incentives generate the largest absolute growth increment.
South AmericaPublic auction reform and currency indexation shape contract structures
Middle East & AfricaHospital construction outpaces local manufacturing, sustaining import dependence.


Geographic strategy in the Intravenous Solution Market now hinges on where a supplier can fill, not merely where it can sell. Freight economics and sovereignty policy both reward proximity.




Download PDF ×

We do not share your information with anyone. However, we may send you emails based on your report interest from time to time. You may contact us at any time to opt-out.