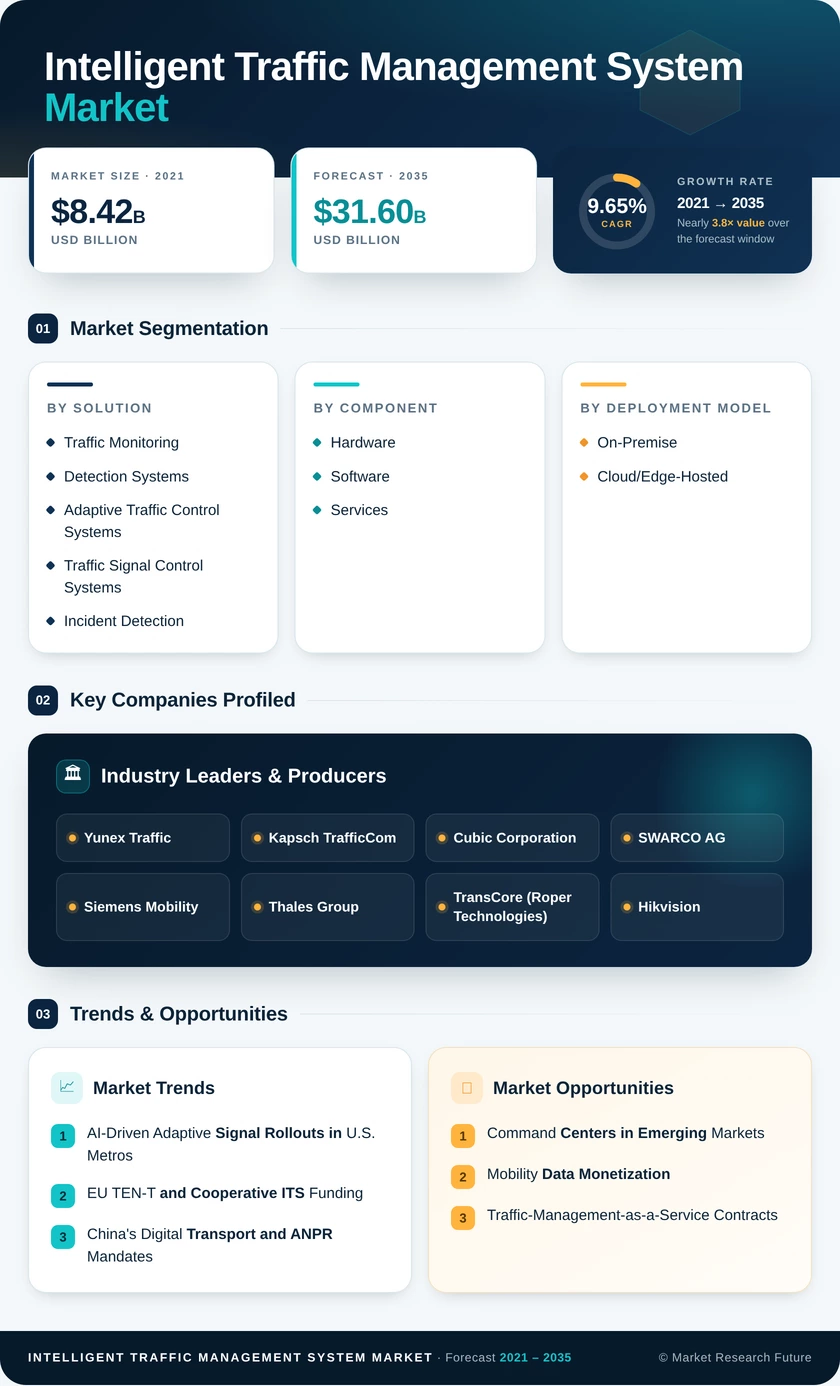
Intelligent Traffic Management System Market (2026 - 2035)

ID: MRFR/AT/9272-HCR 200 Pages Triveni Bhoyar Last Updated: October 09, 2026
Intelligent Traffic Management System Market Research Report By Solution (Traffic Monitoring and Detection Systems, Adaptive Traffic Control Systems, Traffic Signal Control Systems, Incident Detection and Management Systems, Traffic Enforcement Cameras, Journey-Time and Driver Information Systems, Integrated Corridor Management Platforms), By Component (Hardware, Software, Services), By Deployment Model (On-Premise, Cloud/Edge-Hosted), By End-Use Environment (Urban Intersections and Arterials, Freeways and Expressways, Tunnels and Bridges, Parking and Intermodal Hubs) - Forecast to 2035
Intelligent Traffic Management System Market
Market Size
Forecast Period2026-2035
CAGR (2026-2035)9.65%
2025 Market SizeUSD 12.50 Billion
2035 Market SizeUSD 31.60 Billion
Key Players
Yunex Traffic
Kapsch TrafficCom
Cubic Corporation
SWARCO AG
Siemens Mobility
Thales Group
Opportunities
  • Command Centers in Emerging Markets
  • Mobility Data Monetization
  • Traffic-Management-as-a-Service Contracts
  1. 1 Market Summary | |
  2. 2 Key Report Takeaways | |
    1. 2.1 By Solution | |
    2. 2.2 By Component | |
    3. 2.3 By Deployment Model | |
    4. 2.4 By End-Use Environment | |
    5. 2.5 By Region | |
  3. 3 Market Size and Forecast (2021–2035) | |
  4. 4 Driver Impact Analysis | |
    1. 4.1 AI-Driven Adaptive Signal Rollouts in U.S. Metros | |
    2. 4.2 EU TEN-T and Cooperative ITS Funding | |
    3. 4.3 China's Digital Transport and ANPR Mandates | |
    4. 4.4 Congestion Pricing in Tier-1 Cities | |
    5. 4.5 Vision Zero and Road-Safety Targets | |
    6. 4.6 Connected-Vehicle and Probe-Data Integration | |
  5. 5 Restraints Impact Analysis | |
    1. 5.1 High Upfront Costs and Municipal Budget Limits | |
    2. 5.2 Cybersecurity Exposure of Field Devices | |
    3. 5.3 Privacy Rules on ANPR and Video Analytics | |
    4. 5.4 Legacy Controller Interoperability | |
    5. 5.5 Skilled Workforce Gaps | |
  6. 6 Opportunities | |
    1. 6.1 Command Centers in Emerging Markets | |
    2. 6.2 Mobility Data Monetization | |
    3. 6.3 Traffic-Management-as-a-Service Contracts | |
    4. 6.4 V2X-Ready Corridors for Freight and Transit | |
    5. 6.5 Emissions-Linked Traffic Control | |
  7. 7 Regional Market Share and Country-Level Analysis | |
    1. 7.1 North America | | |
      1. 7.1.1 US | | |
      2. 7.1.2 Canada | | |
      3. 7.1.3 Mexico | |
    2. 7.2 Europe | | |
      1. 7.2.1 Germany | | |
      2. 7.2.2 UK | | |
      3. 7.2.3 France | | |
      4. 7.2.4 Italy | | |
      5. 7.2.5 Spain | | |
      6. 7.2.6 Nordic Countries | | |
      7. 7.2.7 Russia | | |
      8. 7.2.8 Rest of Europe | |
    3. 7.3 Asia-Pacific | | |
      1. 7.3.1 China | | |
      2. 7.3.2 India | | |
      3. 7.3.3 Japan | | |
      4. 7.3.4 South Korea | | |
      5. 7.3.5 ASEAN | | |
      6. 7.3.6 Rest of Asia-Pacific | |
    4. 7.4 South America | | |
      1. 7.4.1 Brazil | | |
      2. 7.4.2 Argentina | | |
      3. 7.4.3 Rest of South America | |
    5. 7.5 Middle East & Africa | | |
      1. 7.5.1 Saudi Arabia | | |
      2. 7.5.2 UAE | | |
      3. 7.5.3 South Africa | | |
      4. 7.5.4 Egypt | | |
      5. 7.5.5 Rest of MEA | |
  8. 8 Future Outlook (2026–2035) | |
    1. 8.1 AI-Native and Autonomous Operations | |
    2. 8.2 Platform Economics and Software Subscriptions | |
    3. 8.3 Connected and Automated Vehicle Integration | |
    4. 8.4 Decarbonization and ESG Reporting | |
  9. 9 Segmentation Analysis | |
    1. 9.1 By Solution | | |
      1. 9.1.1 Traffic Monitoring and Detection Systems | | |
      2. 9.1.2 Adaptive Traffic Control Systems | | |
      3. 9.1.3 Traffic Signal Control Systems | | |
      4. 9.1.4 Incident Detection and Management Systems | | |
      5. 9.1.5 Traffic Enforcement Cameras | | |
      6. 9.1.6 Journey-Time and Driver Information Systems | | |
      7. 9.1.7 Integrated Corridor Management Platforms | |
    2. 9.2 By Component | | |
      1. 9.2.1 Hardware | | |
      2. 9.2.2 Software | | |
      3. 9.2.3 Services | |
    3. 9.3 By Deployment Model | | |
      1. 9.3.1 On-Premise | | |
      2. 9.3.2 Cloud/Edge-Hosted | |
    4. 9.4 By End-Use Environment | | |
      1. 9.4.1 Urban Intersections and Arterials | | |
      2. 9.4.2 Freeways and Expressways | | |
      3. 9.4.3 Tunnels and Bridges | | |
      4. 9.4.4 Parking and Intermodal Hubs | |
  10. 10 Competitive Landscape | |
    1. 10.1 Market Concentration Analysis | |
    2. 10.2 Competitive Benchmarking Table | |
    3. 10.3 Company Profiles | | |
      1. 10.3.1 Yunex Traffic | | |
      2. 10.3.2 Kapsch TrafficCom | | |
      3. 10.3.3 Cubic Corporation | | |
      4. 10.3.4 SWARCO AG | | |
      5. 10.3.5 Siemens Mobility | | |
      6. 10.3.6 Thales Group | | |
      7. 10.3.7 TransCore (Roper Technologies) | | |
      8. 10.3.8 Hikvision | | |
      9. 10.3.9 Econolite | | |
      10. 10.3.10 Iteris | | |
      11. 10.3.11 Q-Free ASA | | |
      12. 10.3.12 Miovision | |
  11. 11 Recent News & Developments | |
  12. 12 Report Scope and Methodology | |
  13. 13 Detailed Sources and Citations | |
  14. 14 Frequently Asked Questions (FAQs) | | LIST OF TABLES | |
  15. TABLE 1 Global Market Summary Snapshot, 2025–2035 | |
  16. TABLE 2 Global Market Size & Forecast, by Revenue (USD Billion), 2021–2035 | |
  17. TABLE 3 Driver Impact Analysis on CAGR, 2026–2035 | |
  18. TABLE 4 Restraints Impact Analysis on CAGR, 2026–2035 | |
  19. TABLE 5 Regional Summary, 2025 (USD Billion / Share / CAGR) | |
  20. TABLE 6 North America Market, by Country, 2025–2035 | |
  21. TABLE 7 Europe Market, by Country, 2025–2035 | |
  22. TABLE 8 Asia-Pacific Market, by Country, 2025–2035 | |
  23. TABLE 9 South America Market, by Country, 2025–2035 | |
  24. TABLE 10 Middle East & Africa Market, by Country, 2025–2035 | |
  25. TABLE 11 Global Market, by Solution, 2021–2035 (USD Billion) | |
  26. TABLE 12 Global Market, by Component, 2021–2035 (USD Billion) | |
  27. TABLE 13 Global Market, by Deployment Model, 2021–2035 (USD Billion) | |
  28. TABLE 14 Global Market, by End-Use Environment, 2021–2035 (USD Billion) | |
  29. TABLE 15 Competitive Benchmarking Table, 2025 | |
  30. TABLE 16 Report Scope and Methodology | |
  31. TABLE 17 Detailed Sources and Citations | | LIST OF FIGURES | |
  32. FIGURE 1 Market Dynamics Overview – Drivers, Restraints and Opportunities | |
  33. FIGURE 2 Industry Value Chain Analysis | |
  34. FIGURE 3 Porter's Five Forces Analysis | |
  35. FIGURE 4 Global Market Size Trend, 2021–2035 (USD Billion) | |
  36. FIGURE 5 Year-over-Year Growth Rate, 2022–2035 | |
  37. FIGURE 6 Market Share by Solution, 2025 | |
  38. FIGURE 7 Market Share by Component, 2025 | |
  39. FIGURE 8 Market Share by Deployment Model, 2025 | |
  40. FIGURE 9 Market Share by End-Use Environment, 2025 | |
  41. FIGURE 10 Regional Market Share, 2025 | |
  42. FIGURE 11 Regional CAGR Comparison, 2026–2035 | |
  43. FIGURE 12 North America Country Share, 2025 | |
  44. FIGURE 13 Europe Country Share, 2025 | |
  45. FIGURE 14 Asia-Pacific Country Share, 2025 | |
  46. FIGURE 15 Competitive Landscape – Estimated Revenue Share Ranges, 2025 | |
  47. FIGURE 16 Competitive Positioning Matrix

Segmentation Quick Reference

DimensionSub-SegmentsDominant SegmentFastest Growing Segment
By SolutionTraffic Monitoring and Detection Systems; Adaptive Traffic Control Systems; Traffic Signal Control Systems; Incident Detection and Management Systems; Traffic Enforcement Cameras; Journey-Time and Driver Information Systems; Integrated Corridor Management PlatformsTraffic Monitoring and Detection Systems (23.06% share)Adaptive Traffic Control Systems (10.52% CAGR)
By ComponentHardware; Software; ServicesHardware (54.33% share)Services (12.64% CAGR)
By Deployment ModelOn-Premise; Cloud/Edge-HostedOn-Premise (71.32% share)Cloud/Edge-Hosted (13.92% CAGR)
By End-Use EnvironmentUrban Intersections and Arterials; Freeways and Expressways; Tunnels and Bridges; Parking and Intermodal HubsParking and Intermodal Hubs (43.46% share)Urban Intersections and Arterials (13.17% CAGR)
By RegionNorth America; Europe; Asia-Pacific; South America; Middle East & AfricaNorth America (35.6% share)Asia-Pacific (11.18% CAGR)


Market Segmentation Overview

By Solution

Sub-SegmentKey Trend
Traffic Monitoring and Detection SystemsThermal, LiDAR, and mmWave radar improve all-weather accuracy
Adaptive Traffic Control SystemsAI models continuously retune phase splits
Traffic Signal Control SystemsController-agnostic firmware extends legacy cabinet life
Incident Detection and Management SystemsVideo analytics shorten freeway clearance times
Traffic Enforcement CamerasPricing-zone and red-light enforcement synchronized with adaptive timing
Journey-Time and Driver Information SystemsProbe data feeds dynamic message signs and navigation apps
Integrated Corridor Management PlatformsShared data across adjacent agencies


Traffic Monitoring and Detection Systems lead this dimension because agencies must establish reliable vehicle and pedestrian counts before any optimization can work. Adaptive Traffic Control Systems grow fastest, since AI timing directly cuts intersection delay and qualifies for federal grant programs. Traffic Enforcement Cameras benefit as a secondary effect, because adaptive phases require enforcement systems that refresh at the same rate.

By Component

Sub-SegmentKey Trend
HardwareEdge analytics appliances added to existing cabinets
SoftwareCentral management and AI modules delivered as over-the-air updates
ServicesMulti-year managed operations and maintenance contracts


Hardware dominates because detectors, controllers and communications cabinets are physical prerequisites at every intersection. Services expand fastest as cities without in-house signal engineers contract vendors for monitoring, patching and retiming. Software sits between the two, and its value increasingly depends on how many hardware brands it can manage from one console.

By Deployment Model

Sub-SegmentKey Trend
On-PremiseLocal storage of violation evidence and plate data
Cloud/Edge-HostedHybrid designs with edge safety loops and cloud planning


On-Premise systems lead because evidence-retention laws and data-sovereignty rules keep sensitive camera data on municipal servers. Cloud/Edge-Hosted deployments grow fastest as NIS2 audits and telecom-bundled backhaul favor vendor-managed, patched environments. Edge processing resolves the latency concern, keeping real-time signal decisions local while multi-year archives move to the cloud.

By End-Use Environment

Sub-SegmentKey Trend
Urban Intersections and ArterialsNear-miss analytics and pedestrian-priority phasing
Freeways and ExpresswaysRamp metering and automated incident detection
Tunnels and BridgesSafety-critical monitoring with redundant systems
Parking and Intermodal HubsOccupancy sensors, curbside cameras and payment APIs


Parking and Intermodal Hubs lead because these sites handle the densest mix of private cars, buses, freight and micromobility, and operators earn direct revenue from faster turnover. Urban Intersections and Arterials grow fastest as Vision Zero programs fund near-miss analytics and connected-vehicle data exposes conflicts in real time. Freeways and Expressways remain a stable base, anchored by incident management and ramp metering.


 

Download PDF ×

We do not share your information with anyone. However, we may send you emails based on your report interest from time to time. You may contact us at any time to opt-out.