ID: MRFR/Pharma/3026-HCR | February 2021 | Region: Global | 85 pages
Market Synopsis of Global Insulinoma Market
Market Scenario
Insulinoma is a rare form of tumour of the beta cells of pancreas resulting in an excessive secretion of insulin, leading to hypoglycaemia. Most insulinomas are benign, however a few metastasize. The symptoms of insulinoma are hypoglycaemia and associated symptoms such as blurred vision, lethargy, diplopia, light headedness, and convulsions, unconsciousness, which can also be life-threatening. Severe hypoglycemia may result in seizures, coma, and permanent neurological damage. Symptoms such as palpitations, tachycardia, sweating, hunger, anxiety etc. are caused by catecholaminergic response to hypoglycaemia triggered by insulinomas.
Insulinomas occur in people between the ages of 40 and 60 and grow slowly. The exact causes of insulinoma are unknown, however, patients with multiple endocrine neplasia type 1 syndrome or von Hippel-Landau syndrome are more at risk. According to a cancer research, 10% of insulinomas are cancerous and approximately 10% of patients diagnosed with insulinoma have more than one tumour. Insulinomas affect between up to five people out of one million each year.
Surgery is the definitive treatment for insulinomas and 90% of patients are cured of the condition. However, surgery can cause diabetes if significant amount of the pancreas are removed. The development of minimal invasive surgery procedures such as laparoscopy has resulted in replacement of open pancreatomy which was once the gold standard of treatment. The market constraints are lack of awareness, misdiagnosis of the disease, risk of surgery, high cost of treatment etc.
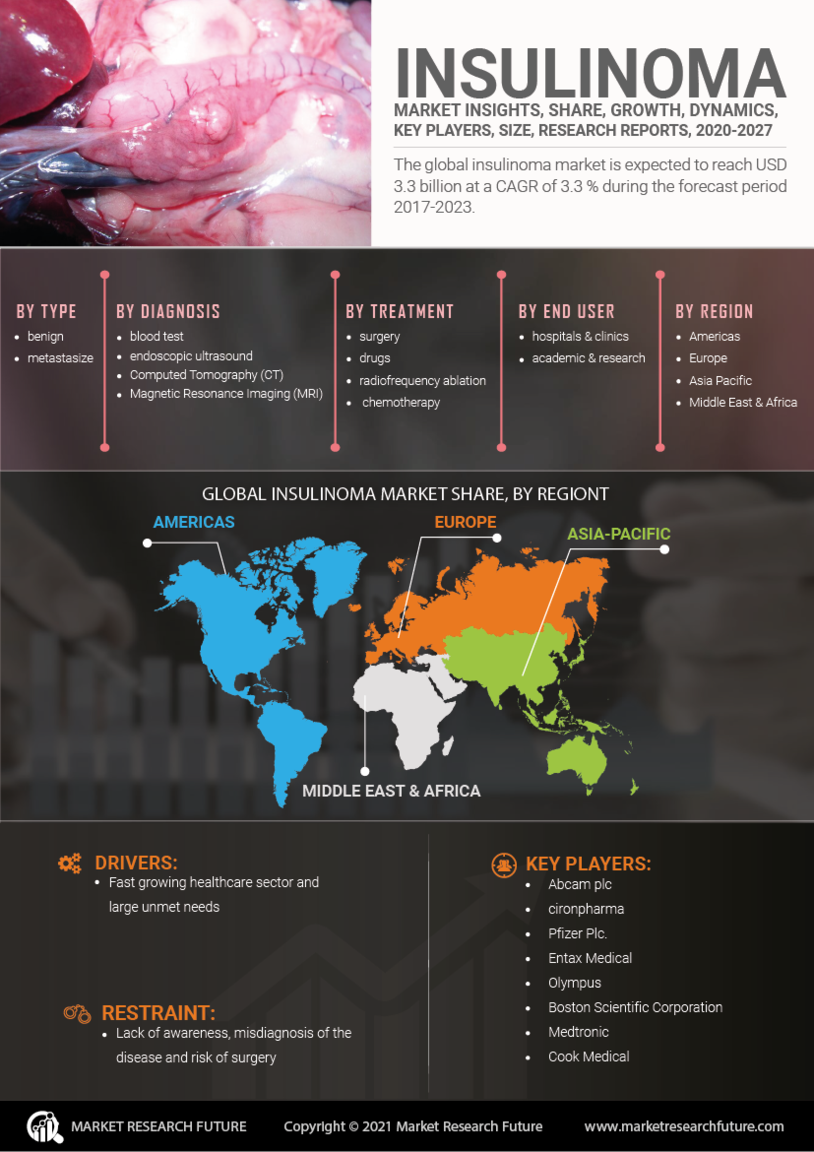
The global insulinoma market is expected to reach USD 3.3 billion by 2023, and the market is projected to grow at a CAGR of ~ 3.3 % during the forecast period 2017-2023.
Research Methodology
Intended Audience
Figure 1 Global insulinoma market by types, 2016 (%)
Segments:
The global insulinoma market has been segmented on the basis of type, diagnosis, treatment, and end user.
Based on type, the market has been segmented as benign, and metastasize.
Based on diagnosis, the market has been segmented as blood test, endoscopic ultrasound, Computed Tomography (CT), Magnetic Resonance Imaging (MRI) and others.
Based on treatment, the market has been segmented as surgery, drugs, radiofrequency ablation, chemotherapy and others.
Based on the end user, the market has been segmented as hospitals & clinics, academic and research, and others.
Regional Analysis
The Americas account for a significant market share owing to extensive use of medications and high expenditure on the health care. Additionally, the fastest uptake of new products and surgical procedures in the US drives the insulinoma market. Also, concentration of major healthcare companies in the developed countries of this region coupled with the larger insurance penetration is adding fuel to the market growth. Moreover, the US expend high on the healthcare, which accounts for 16% of GDP also cruises the sale of insulinoma treatment.
Europe is the second largest market in the world due to high income and strong healthcare penetration. European market growth is led by countries such as Germany and France. The UK is expected to be the fastest growing market over the assessment period.
Asia Pacific region is expected to grow rapidly and China and India are likely to lead this market due to fast growing healthcare sector and large unmet needs during the forecast period. South East Asian countries such as Vietnam, Thailand, and Malaysia are projected to contribute highly to the market growth.
Gulf nations such as Saudi Arabia and the UAE are estimated to drive the Middle East & African market. Other Middle East nations to watch out for will be Kuwait, Jordan, Egypt and Iran. The African region is expected to witness a moderate growth owing to poor economic and political conditions and poor healthcare development. However, Africa has the highest unmet needs in the world and cost-effective products will be the key to dominate the African market.
Key Players in the Global Insulinoma Market
ome of key players profiled in the report are Abcam plc, cironpharma, Pfizer Plc., Entax Medical, Olympus, Boston Scientific Corporation, Medtronic, Cook Medical, Cook Medical, Inc., and others.
Table of Content
1. Report Prologue
2. Market Introduction
2.1 Definition
2.2 Scope of the Study
2.2.1 Research Objective
2.2.2 Assumptions
2.2.3 Limitations
3. Research Methodology
3.1 Introduction
3.2 Primary Research
3.3 Secondary research
3.4 Market Size Estimation
4. Market Dynamics
4.1 Drivers
4.2 Restrains
4.3 Opportunities
4.4 Challenges
4.5 Macroeconomic Indicators
4.6 Technology Trends & Assessment
5. Market Factor Analysis
5.1 Porters Five Forces Analysis
5.1.1 Bargaining Power of Suppliers
5.1.2 Bargaining Power of Buyers
5.1.3 Threat of New Entrants
5.1.4 Threat of Substitutes
5.1.5 Intensity of Rivalry
5.2 Value Chain Analysis
5.3 Investment Feasibility Analysis
5.4 Pricing Analysis
6. Global Insulinoma Market, by Types
6.1 Introduction
6.2 Benign
6.2.1 Market Estimates & Forecast, 2017-2023
6.3 Metastasize
6.3.1 Market Estimates & Forecast, 2017-2023
7. Global Insulinoma Market, by Diagnosis
7.1 Introduction
7.2 Blood Test
7.2.1 Market Estimates & Forecast, 2017-2023
7.3 Endoscopic Ultrasound
7.3.1 Market Estimates & Forecast, 2017-2023
7.4 Computed Tomography (CT)
7.4.1 Market Estimates & Forecast, 2017-2023
7.5 Magnetic Resonance Imaging (MRI)
7.5.1 Market Estimates & Forecast, 2017-2023
7.6 Others
7.6.1 Market Estimates & Forecast, 2017-2023
8. Global Insulinoma Market, by Treatment
8.1 Introduction
8.2 Surgery
8.2.1 Market Estimates & Forecast, 2017-2023
8.3 Drugs
8.3.1 Market Estimates & Forecast, 2017-2023
8.4 Radiofrequency Ablation
8.4.1 Market Estimates & Forecast, 2017-2023
8.5 Chemotherapy
8.5.1 Market Estimates & Forecast, 2017-2023
8.6 Other
8.6.1 Market Estimates & Forecast, 2017-2023
9. Global Insulinoma Market, by End User
9.1 Introduction
9.2 Hospitals & Clinics
9.2.1 Market Estimates & Forecast, 2017-2023
9.3 Academic and Research Institutes
9.3.1 Market Estimates & Forecast, 2017-2023
9.4 Others
9.4.1 Market Estimates & Forecast, 2017-2023
10. Global Insulinoma Market, by Region
10.1 Introduction
10.2 Americas
10.2.1 North America
10.2.1.1 US
10.2.1.2 Canada
10.2.2 South America
10.3 Europe
10.3.1 Western Europe
10.3.1.1 Germany
10.3.1.2 France
10.3.1.3 UK
10.3.1.4 Italy
10.3.1.5 Spain
10.3.1.6 Rest of Western Europe
10.3.2 Eastern Europe
10.4 Asia Pacific
10.4.1 Japan
10.4.2 China
10.4.3 India
10.4.4 Australia
10.4.5 Republic of Korea
10.4.6 Rest of Asia Pacific
10.5 The Middle East & Africa
10.5.1 United Arab Emirates
10.5.2 Saudi Arabia
10.5.3 Oman
10.5.4 Kuwait
10.5.5 Qatar
10.5.6 Rest of the Middle East & Africa
11 Company Landscape
11.1 Introduction
11.2 Market Share Analysis
11.3 Key Development & Strategies
11.3.1 Key Developments
12 Company Profiles
12.1 Abcam plc
12.1.1 Overview
12.1.2 Product Overview
12.1.3 Financials
12.1.4 Key Developments
12.2 cironpharma
12.2.1 Overview
12.2.2 Product Overview
12.2.3 Financials
12.2.4 Key Developments
12.3 Entax Medical
12.3.1 Overview
12.3.2 Product Overview
12.3.3 Financials
12.3.4 Key Development
12.4 Pfizer Plc.
12.4.1 Overview
12.4.2 Product Overview
12.4.3 Financials
12.4.4 Key Development
12.5 Olympus
12.5.1 Overview
12.5.2 Product Overview
12.5.3 Financials
12.5.4 Key Development
12.6 Medtronic
12.6.1 Overview
12.6.2 Product Overview
12.6.3 Financials
12.6.4 Key Development
12.7 Boston Scientific Corporation
12.7.1 Overview
12.7.2 Product Overview
12.7.3 Financials
12.7.4 Key Development
12.8 Cook Medical
12.8.1 Overview
12.8.2 Product Overview
12.8.3 Financials
12.8.4 Key Development
12.9 Cook Medical, Inc.
12.9.1 Overview
12.9.2 Product Overview
12.9.3 Financials
12.9.4 Key Development
12.10 Others
12.10.1 Overview
12.10.2 Product Overview
12.10.3 Financials
12.10.4 Key Development
13 MRFR Conclusion
13.1 Key Findings
13.1.1 From CEO’s View Point
13.1.2 Unmet Needs of the Market
13.2 Key Companies to Watch
13.3 Prediction of Pharmaceutical Industry
14 Appendix
List of Tables
TABLE 1 GLOBAL INSULINOMA MARKET, BY TYPE, 2017-2023 (USD MILLION)
TABLE 2 BENIGN FOR INSULINOMA MARKET, BY REGION, 2017-2023 (USD MILLION)
TABLE 3 METASTASIZE FOR INSULINOMA MARKET, BY REGION 2017-2023 (USD
MILLION)
TABLE 4 GLOBAL INSULINOMA MARKET, BY DIAGNOSIS, 2017-2023 (USD MILLION)
TABLE 5 BLOOD TEST FOR INSULINOMA MARKET, BY REGION, 2017-2023 (USD MILLION)
TABLE 6 ENDOSCOPIC ULTRASOUND FOR INSULINOMA MARKET, BY REGION 2017-2023 (USD MILLION)
TABLE 7 COMPUTED TOMOGRAPHY (CT) FOR INSULINOMA MARKET, BY REGION 2017-2023 (USD MILLION)
TABLE 8 MAGNETIC RESONANCE IMAGING (MRI) FOR INSULINOMA MARKET, BY REGION 2017-2023 (USD MILLION)
TABLE 9 OTHERS FOR INSULINOMA MARKET, BY REGION 2017-2023 (USD MILLION)
TABLE 10 GLOBAL INSULINOMA MARKET, BY TREATMENT, 2017-2023 (USD MILLION)
TABLE 11 SURGERY FOR INSULINOMA MARKET, BY REGION 2017-2023 (USD MILLION)
TABLE 12 DRUGS FOR INSULINOMA MARKET, BY REGION 2017-2023 (USD
MILLION)
TABLE 13 RADIOFREQUENCY ABLATION FOR INSULINOMA MARKET, BY REGION 2017-2023 (USD
MILLION)
TABLE 14 CHEMOTHERAPY FOR INSULINOMA MARKET, BY REGION 2017-2023 (USD
MILLION)
TABLE 15 OTHERS FOR INSULINOMA MARKET, BY REGION 2017-2023 (USD MILLION)
TABLE 16 GLOBAL INSULINOMA MARKET, BY END USER, 2017-2023 (USD MILLION)
TABLE 17 NORTH AMERICA INSULINOMA MARKET, BY COUNTRY 2017-2023 (USD MILLION)
TABLE 18 NORTH AMERICA INSULINOMA MARKET, BY TYPE 2017-2023 (USD MILLION)
TABLE 19 NORTH AMERICA INSULINOMA MARKET, BY DIAGNOSIS 2017-2023 (USD MILLION)
TABLE 20 NORTH AMERICA INSULINOMA MARKET, BY TREATMENT 2017-2023 (USD
MILLION)
TABLE 21 NORTH AMERICA INSULINOMA MARKET, BY END USER, 2017-2023 (USD MILLION)
TABLE 22 NORTH AMERICA INSULINOMA MARKET BY REGION 2017-2023 (USD MILLION
TABLE 23 EUROPE INSULINOMA MARKET BY COUNTRY 2017-2023 (USD MILLION)
TABLE 24 EUROPE INSULINOMA MARKET, BY TYPE 2017-2023 (USD MILLION)
TABLE 25 EUROPE INSULINOMA MARKET, BY DIAGNOSIS 2017-2023 (USD MILLION)
TABLE 26 EUROPE INSULINOMA MARKET, BY TREATMENT 2017-2023 (USD MILLION)
TABLE 27 EUROPE INSULINOMA MARKET, BY END USER, 2017-2023 (USD MILLION)
TABLE 28 EUROPE INSULINOMA MARKET, BY REGION 2017-2023 (USD MILLION)
TABLE 29 ASIA PACIFIC INSULINOMA MARKET BY COUNTRY 2017-2023 (USD MILLION)
TABLE 30 ASIA PACIFIC INSULINOMA MARKET, BY TYPE 2017-2023 (USD MILLION)
TABLE 31 ASIA PACIFIC INSULINOMA MARKET, BY DIAGNOSIS 2017-2023 (USD MILLION)
TABLE 32 ASIA PACIFIC INSULINOMA MARKET, BY TREATMENT 2017-2023 (USD MILLION)
TABLE 33 ASIA PACIFIC INSULINOMA MARKET, BY END USER, 2017-2023 (USD MILLION)
TABLE 34 ASIA PACIFIC INSULINOMA MARKET, BY REGION 2017-2023 (USD MILLION)
TABLE 35 MIDDLE EAST & AFRICA INSULINOMA MARKET, BY REGION 2017-2023 (USD MILLION)
TABLE 36 MIDDLE EAST & AFRICA INSULINOMA MARKET BY COUNTRY 2017-2023 (USD MILLION)
TABLE 37 MIDDLE EAST & AFRICA INSULINOMA MARKET, BY TYPE 2017-2023 (USD MILLION)
TABLE 38 MIDDLE EAST & AFRICA INSULINOMA MARKET, BY DIAGNOSIS 2017-2023 (USD MILLION)
TABLE 39 MIDDLE EAST & AFRICA INSULINOMA MARKET, BY TREATMENT 2017-2023 (USD MILLION)
TABLE 40 MIDDLE EAST & AFRICA INSULINOMA MARKET, BY END USER, 2017-2023 (USD MILLION)
TABLE 41 MIDDLE EAST & AFRICA INSULINOMA MARKET, BY REGION 2017-2023 (USD MILLION)
List of Figures
FIGURE 1 RESEARCH PROCESS
FIGURE 2 MARKET DYNAMICS FOR GLOBAL INSULINOMA MARKET
FIGURE 3 GLOBAL INSULINOMA MAKRET, BY SEGMENT, 2016
FIGURE 4 GLOBAL INSULINOMA MARKET, BY REGION
FIGURE 5 GLOBAL INSULINOMA MARKET SHARE, BY TYPE 2016
FIGURE 6 GLOBAL INSULINOMA MARKET SHARE, BY DIAGNOSIS 2016
FIGURE 7 GLOBAL INSULINOMA MARKET SHARE, BY TREATMENT, 2016
FIGURE 8 GLOBAL INSULINOMA MARKET SHARE, BY END USER, 2016
FIGURE 9 GLOBAL INSULINOMA MARKET SHARE, 2016
FIGURE 10 GLOBAL INSULINOMA MARKET SHARE, BY REGION, 2016
FIGURE 11 NORTH AMERICA INSULINOMA MARKET SHARE, BY COUNTRY, 2016
FIGURE 12 EUROPE INSULINOMA MARKET SHARE, BY COUNTRY, 2016
FIGURE 13 ASIA PACIFIC INSULINOMA MARKET SHARE, BY COUNTRY, 2016
FIGURE 14 MIDDLE EAST & AFRICA INSULINOMA MARKET, BY REGION, 2016
FIGURE 15 GLOBAL INSULINOMA MARKET: COMPANY SHARE ANALYSIS, 2016 (%)
FIGURE 16 ABCAM PLC.: KEY FINANCIALS
FIGURE 17 ABCAM PLC: SEGMENTAL REVENUE
FIGURE 18 ABCAM PLC: GEOGRAPHICAL REVENUE
FIGURE 19 CIRONPHARMA: KEY FINANCIALS
FIGURE 20 CIRONPHARMA: SEGMENTAL REVENUE
FIGURE 21 CIRONPHARMA: GEOGRAPHICAL REVENUE
FIGURE 22 PFIZER PLC.: KEY FINANCIALS
FIGURE 23 PFIZER PLC.: SEGMENTAL REVENUE
FIGURE 24 PFIZER PLC.: GEOGRAPHICAL REVENUE
FIGURE 25 ENTAX MEDICAL: KEY FINANCIALS
FIGURE 26 ENTAX MEDICAL: SEGMENTAL REVENUE
FIGURE 27 ENTAX MEDICAL: GEOGRAPHICAL REVENUE
FIGURE 28 OLYMPUS: FINANCIAL REVENUE
FIGURE 29 OLYMPUS: SEGMENTAL REVENUE
FIGURE 30 OLYMPUS: GEOGRPAHICAL REVENUE
FIGURE 31 BOSTON SCIENTIFIC CORPORATION: FINANCIAL REVENUE
FIGURE 32 BOSTON SCIENTIFIC CORPORATION: SEGMENTAL REVENUE
FIGURE 33 BOSTON SCIENTIFIC CORPORATION: GEOGRPAHICAL REVENUE