

Food, Beverages & Nutrition Market Segmentation
Food, Beverages & Nutrition By Type (USD Billion, 2025-2035)
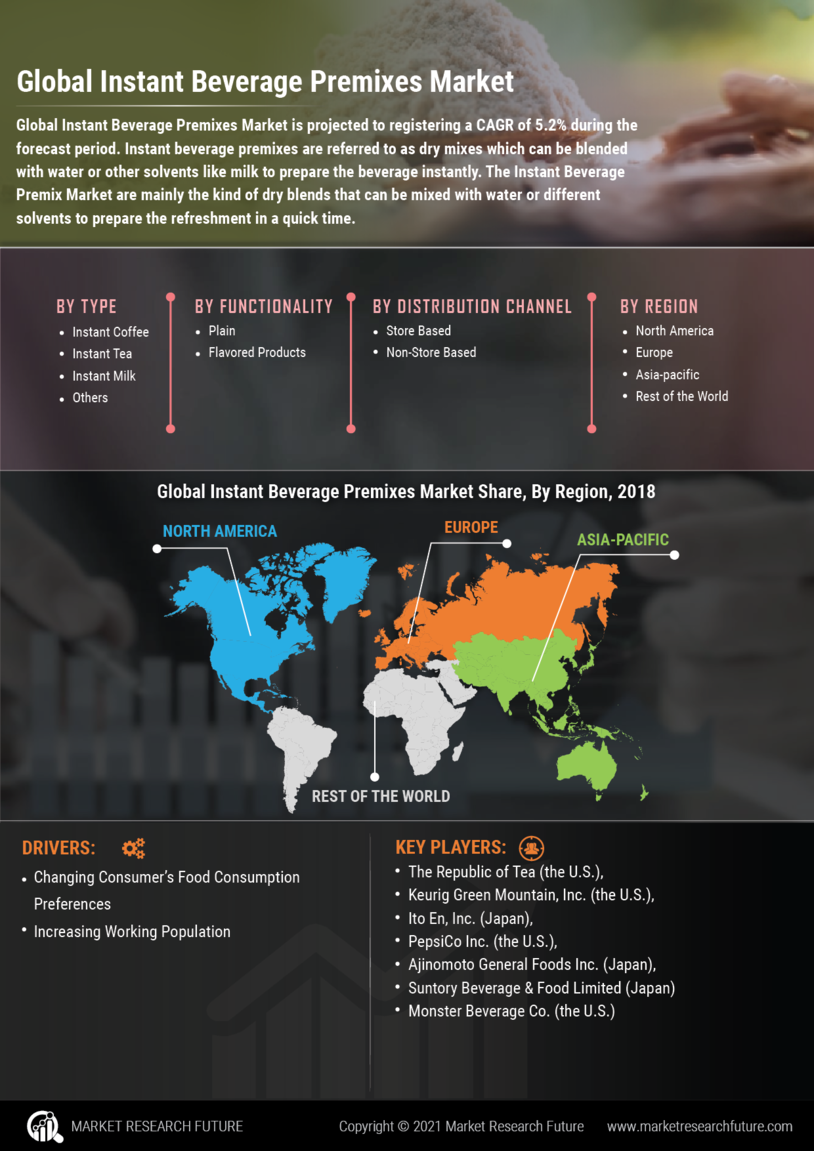
- Instant Coffee
- Instant Tea
- Instant Milk
- Instant Health Drinks
- Instant Soup
- Others
Food, Beverages & Nutrition By Function (USD Billion, 2025-2035)
- Plain
- Flavored
- Others
Food, Beverages & Nutrition By Distribution Channel (USD Billion, 2025-2035)
- Store Based
- Non-Store Based


