India Sturge Weber Syndrome Market Segmentation
India Sturge Weber Syndrome Market By Type (USD Million, 2025-2035)
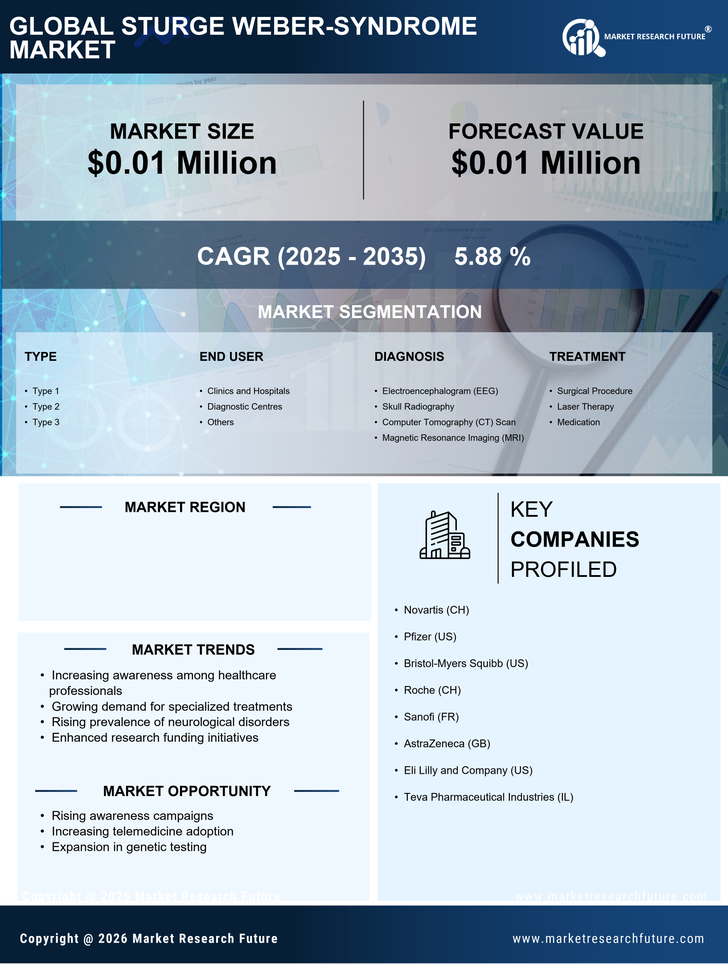
- Type 1
- Type 2
- Type 3
India Sturge Weber Syndrome Market By End User (USD Million, 2025-2035)
- Clinics and Hospitals
- Diagnostic Centres
- Others
India Sturge Weber Syndrome Market By Diagnosis (USD Million, 2025-2035)
- Electroencephalogram (EEG)
- Skull Radiography
- Computer Tomography (CT) Scan
- Magnetic Resonance Imaging (MRI)
India Sturge Weber Syndrome Market By Treatment (USD Million, 2025-2035)
- Surgical Procedure
- Laser Therapy
- Medication