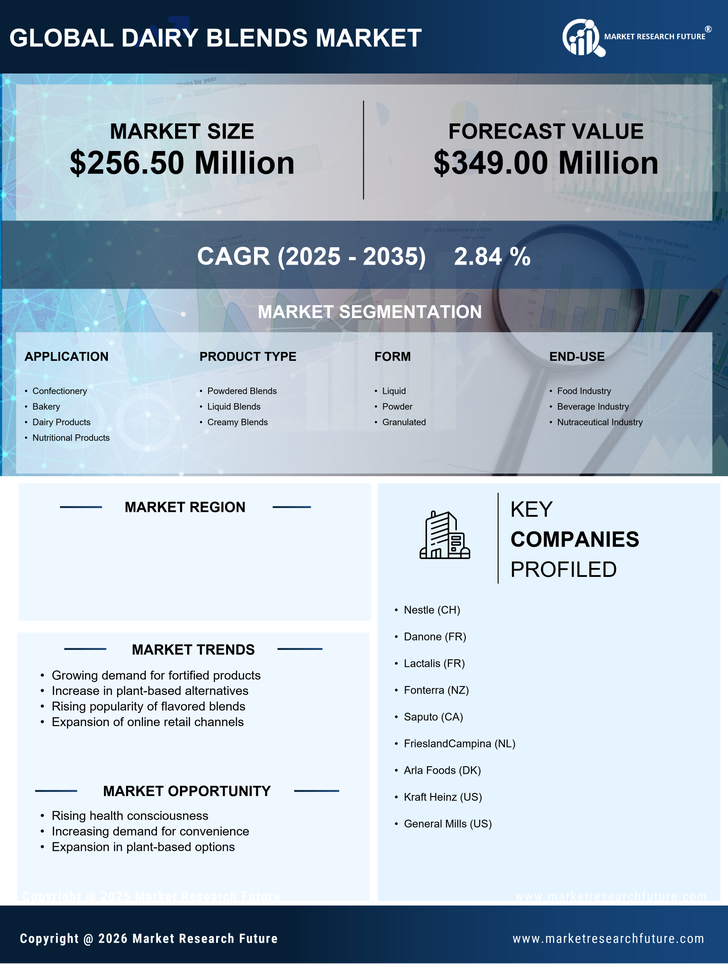
Request Free Sample ×

Kindly complete the form below to receive a free sample of this Report

* Please use a valid business email

Leading companies partner with us for data-driven Insights

clients tt-cursor
Hero Background

India Dairy Blends Market

ID: MRFR/FnB/46674-HCR
128 Pages
Sakshi Gupta
Last Updated: April 06, 2026

India Dairy Blends Market Size, Share, Industry Trend & Analysis Research Report By Type (Dairy Mixture, Dairy/Non-Dairy Ingredients, Dairy as a Functional Ingredient, Dairy as a Carrier), By Form (Spreadable, Liquid, Powder, Others) and By Application (Ice Cream and Frozen Desserts, Sweet and Savory Snacks, Bakery and Confectionery, Infant Nutrition and Baby Food, Beverages, Meat, Seafood, Dietary Supplements) - Forecast to 2035.

Share:
Download PDF ×

We do not share your information with anyone. However, we may send you emails based on your report interest from time to time. You may contact us at any time to opt-out.

India Dairy Blends Market Infographic
Purchase Options
  1. 1 SECTION I: EXECUTIVE SUMMARY AND KEY HIGHLIGHTS
  2.   1.1 EXECUTIVE SUMMARY
  3.     1.1.1 Market Overview
  4.     1.1.2 Key Findings
  5.     1.1.3 Market Segmentation
  6.     1.1.4 Competitive Landscape
  7.     1.1.5 Challenges and Opportunities
  8.     1.1.6 Future Outlook
  9. 2 SECTION II: SCOPING, METHODOLOGY AND MARKET STRUCTURE
  10.   2.1 MARKET INTRODUCTION
  11.     2.1.1 Definition
  12.     2.1.2 Scope of the study
  13.       2.1.2.1 Research Objective
  14.       2.1.2.2 Assumption
  15.       2.1.2.3 Limitations
  16.   2.2 RESEARCH METHODOLOGY
  17.     2.2.1 Overview
  18.     2.2.2 Data Mining
  19.     2.2.3 Secondary Research
  20.     2.2.4 Primary Research
  21.       2.2.4.1 Primary Interviews and Information Gathering Process
  22.       2.2.4.2 Breakdown of Primary Respondents
  23.     2.2.5 Forecasting Model
  24.     2.2.6 Market Size Estimation
  25.       2.2.6.1 Bottom-Up Approach
  26.       2.2.6.2 Top-Down Approach
  27.     2.2.7 Data Triangulation
  28.     2.2.8 Validation
  29. 3 SECTION III: QUALITATIVE ANALYSIS
  30.   3.1 MARKET DYNAMICS
  31.     3.1.1 Overview
  32.     3.1.2 Drivers
  33.     3.1.3 Restraints
  34.     3.1.4 Opportunities
  35.   3.2 MARKET FACTOR ANALYSIS
  36.     3.2.1 Value chain Analysis
  37.     3.2.2 Porter's Five Forces Analysis
  38.       3.2.2.1 Bargaining Power of Suppliers
  39.       3.2.2.2 Bargaining Power of Buyers
  40.       3.2.2.3 Threat of New Entrants
  41.       3.2.2.4 Threat of Substitutes
  42.       3.2.2.5 Intensity of Rivalry
  43.     3.2.3 COVID-19 Impact Analysis
  44.       3.2.3.1 Market Impact Analysis
  45.       3.2.3.2 Regional Impact
  46.       3.2.3.3 Opportunity and Threat Analysis
  47. 4 SECTION IV: QUANTITATIVE ANALYSIS
  48.   4.1 Construction, BY Application (USD Million)
  49.     4.1.1 Confectionery
  50.     4.1.2 Bakery
  51.     4.1.3 Dairy Products
  52.     4.1.4 Nutritional Products
  53.   4.2 Construction, BY Product Type (USD Million)
  54.     4.2.1 Powdered Blends
  55.     4.2.2 Liquid Blends
  56.     4.2.3 Creamy Blends
  57.   4.3 Construction, BY Form (USD Million)
  58.     4.3.1 Liquid
  59.     4.3.2 Powder
  60.     4.3.3 Granulated
  61.   4.4 Construction, BY End-use (USD Million)
  62.     4.4.1 Food Industry
  63.     4.4.2 Beverage Industry
  64.     4.4.3 Nutraceutical Industry
  65. 5 SECTION V: COMPETITIVE ANALYSIS
  66.   5.1 Competitive Landscape
  67.     5.1.1 Overview
  68.     5.1.2 Competitive Analysis
  69.     5.1.3 Market share Analysis
  70.     5.1.4 Major Growth Strategy in the Construction
  71.     5.1.5 Competitive Benchmarking
  72.     5.1.6 Leading Players in Terms of Number of Developments in the Construction
  73.     5.1.7 Key developments and growth strategies
  74.       5.1.7.1 New Product Launch/Service Deployment
  75.       5.1.7.2 Merger & Acquisitions
  76.       5.1.7.3 Joint Ventures
  77.     5.1.8 Major Players Financial Matrix
  78.       5.1.8.1 Sales and Operating Income
  79.       5.1.8.2 Major Players R&D Expenditure. 2023
  80.   5.2 Company Profiles
  81.     5.2.1 Nestle (CH)
  82.       5.2.1.1 Financial Overview
  83.       5.2.1.2 Products Offered
  84.       5.2.1.3 Key Developments
  85.       5.2.1.4 SWOT Analysis
  86.       5.2.1.5 Key Strategies
  87.     5.2.2 Danone (FR)
  88.       5.2.2.1 Financial Overview
  89.       5.2.2.2 Products Offered
  90.       5.2.2.3 Key Developments
  91.       5.2.2.4 SWOT Analysis
  92.       5.2.2.5 Key Strategies
  93.     5.2.3 Lactalis (FR)
  94.       5.2.3.1 Financial Overview
  95.       5.2.3.2 Products Offered
  96.       5.2.3.3 Key Developments
  97.       5.2.3.4 SWOT Analysis
  98.       5.2.3.5 Key Strategies
  99.     5.2.4 Fonterra (NZ)
  100.       5.2.4.1 Financial Overview
  101.       5.2.4.2 Products Offered
  102.       5.2.4.3 Key Developments
  103.       5.2.4.4 SWOT Analysis
  104.       5.2.4.5 Key Strategies
  105.     5.2.5 Saputo (CA)
  106.       5.2.5.1 Financial Overview
  107.       5.2.5.2 Products Offered
  108.       5.2.5.3 Key Developments
  109.       5.2.5.4 SWOT Analysis
  110.       5.2.5.5 Key Strategies
  111.     5.2.6 FrieslandCampina (NL)
  112.       5.2.6.1 Financial Overview
  113.       5.2.6.2 Products Offered
  114.       5.2.6.3 Key Developments
  115.       5.2.6.4 SWOT Analysis
  116.       5.2.6.5 Key Strategies
  117.     5.2.7 Arla Foods (DK)
  118.       5.2.7.1 Financial Overview
  119.       5.2.7.2 Products Offered
  120.       5.2.7.3 Key Developments
  121.       5.2.7.4 SWOT Analysis
  122.       5.2.7.5 Key Strategies
  123.     5.2.8 Kraft Heinz (US)
  124.       5.2.8.1 Financial Overview
  125.       5.2.8.2 Products Offered
  126.       5.2.8.3 Key Developments
  127.       5.2.8.4 SWOT Analysis
  128.       5.2.8.5 Key Strategies
  129.     5.2.9 General Mills (US)
  130.       5.2.9.1 Financial Overview
  131.       5.2.9.2 Products Offered
  132.       5.2.9.3 Key Developments
  133.       5.2.9.4 SWOT Analysis
  134.       5.2.9.5 Key Strategies
  135.   5.3 Appendix
  136.     5.3.1 References
  137.     5.3.2 Related Reports
  138. 6 LIST OF FIGURES
  139.   6.1 MARKET SYNOPSIS
  140.   6.2 INDIA MARKET ANALYSIS BY APPLICATION
  141.   6.3 INDIA MARKET ANALYSIS BY PRODUCT TYPE
  142.   6.4 INDIA MARKET ANALYSIS BY FORM
  143.   6.5 INDIA MARKET ANALYSIS BY END-USE
  144.   6.6 KEY BUYING CRITERIA OF CONSTRUCTION
  145.   6.7 RESEARCH PROCESS OF MRFR
  146.   6.8 DRO ANALYSIS OF CONSTRUCTION
  147.   6.9 DRIVERS IMPACT ANALYSIS: CONSTRUCTION
  148.   6.10 RESTRAINTS IMPACT ANALYSIS: CONSTRUCTION
  149.   6.11 SUPPLY / VALUE CHAIN: CONSTRUCTION
  150.   6.12 CONSTRUCTION, BY APPLICATION, 2024 (% SHARE)
  151.   6.13 CONSTRUCTION, BY APPLICATION, 2024 TO 2035 (USD Million)
  152.   6.14 CONSTRUCTION, BY PRODUCT TYPE, 2024 (% SHARE)
  153.   6.15 CONSTRUCTION, BY PRODUCT TYPE, 2024 TO 2035 (USD Million)
  154.   6.16 CONSTRUCTION, BY FORM, 2024 (% SHARE)
  155.   6.17 CONSTRUCTION, BY FORM, 2024 TO 2035 (USD Million)
  156.   6.18 CONSTRUCTION, BY END-USE, 2024 (% SHARE)
  157.   6.19 CONSTRUCTION, BY END-USE, 2024 TO 2035 (USD Million)
  158.   6.20 BENCHMARKING OF MAJOR COMPETITORS
  159. 7 LIST OF TABLES
  160.   7.1 LIST OF ASSUMPTIONS
  161.     7.1.1
  162.   7.2 India MARKET SIZE ESTIMATES; FORECAST
  163.     7.2.1 BY APPLICATION, 2025-2035 (USD Million)
  164.     7.2.2 BY PRODUCT TYPE, 2025-2035 (USD Million)
  165.     7.2.3 BY FORM, 2025-2035 (USD Million)
  166.     7.2.4 BY END-USE, 2025-2035 (USD Million)
  167.   7.3 PRODUCT LAUNCH/PRODUCT DEVELOPMENT/APPROVAL
  168.     7.3.1
  169.   7.4 ACQUISITION/PARTNERSHIP
  170.     7.4.1

India Construction Market Segmentation

Construction By Application (USD Million, 2025-2035)

  • Confectionery
  • Bakery
  • Dairy Products
  • Nutritional Products

Construction By Product Type (USD Million, 2025-2035)

  • Powdered Blends
  • Liquid Blends
  • Creamy Blends

Construction By Form (USD Million, 2025-2035)

  • Liquid
  • Powder
  • Granulated

Construction By End-use (USD Million, 2025-2035)

  • Food Industry
  • Beverage Industry
  • Nutraceutical Industry

Compare Licence

×
Features License Type
Single User Multiuser License Enterprise User
Price $4,950 $5,950 $7,250
Maximum User Access Limit 1 User Upto 10 Users Unrestricted Access Throughout the Organization
Free Customization
Direct Access to Analyst
Deliverable Format
Platform Access
Discount on Next Purchase 10% 15% 15%
Printable Versions