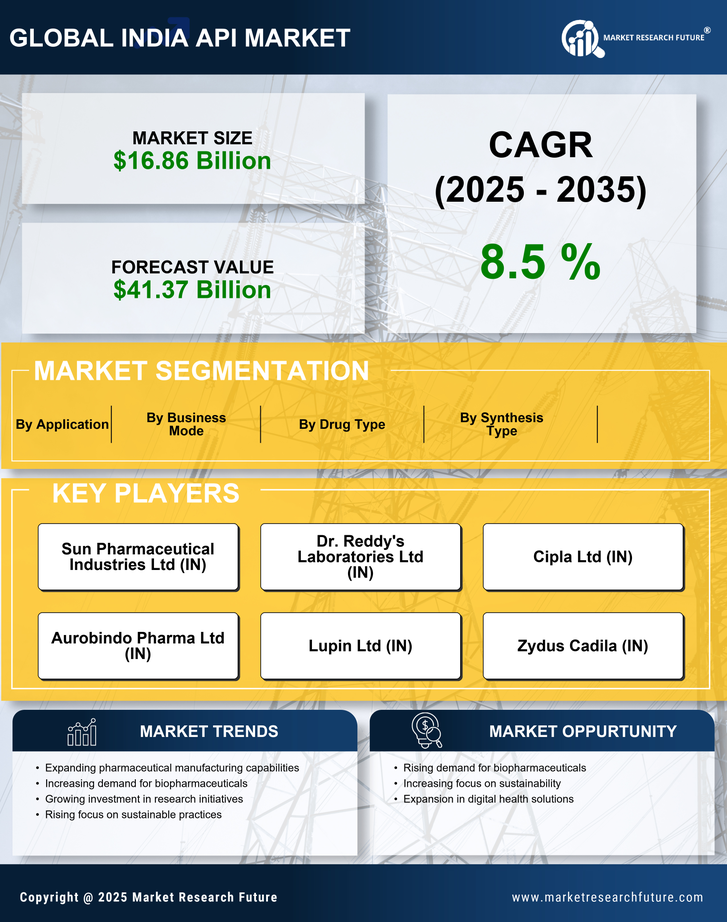
Request Free Sample ×

Kindly complete the form below to receive a free sample of this Report

* Please use a valid business email

Leading companies partner with us for data-driven Insights

clients tt-cursor
Hero Background

India API Market

ID: MRFR/Pharma/19812-HCR
128 Pages
Rahul Gotadki
Last Updated: April 06, 2026

India API Market Research Report Information By Business Mode (Captive API and Merchant API), By Synthesis Type (Synthetic and Biotech), By Drug Type (Generic and Branded), By Application (Cardiology, Oncology, Pulmonology, Neurology, Orthopedic, Ophthalmology, and Other Applications), - India Market Forecast Till 2035

Share:
Download PDF ×

We do not share your information with anyone. However, we may send you emails based on your report interest from time to time. You may contact us at any time to opt-out.

India API Market Infographic
Purchase Options
  1. SECTION I: EXECUTIVE SUMMARY AND KEY HIGHLIGHTS |
    1. 1.1 EXECUTIVE SUMMARY | |
      1. 1.1.1 Market Overview | |
      2. 1.1.2 Key Findings | |
      3. 1.1.3 Market Segmentation | |
      4. 1.1.4 Competitive Landscape | |
      5. 1.1.5 Challenges and Opportunities | |
      6. 1.1.6 Future Outlook 2
  2. SECTION II: SCOPING, METHODOLOGY AND MARKET STRUCTURE |
    1. 2.1 MARKET INTRODUCTION | |
      1. 2.1.1 Definition | |
      2. 2.1.2 Scope of the study | | |
        1. 2.1.2.1 Research Objective | | |
        2. 2.1.2.2 Assumption | | |
        3. 2.1.2.3 Limitations |
    2. 2.2 RESEARCH METHODOLOGY | |
      1. 2.2.1 Overview | |
      2. 2.2.2 Data Mining | |
      3. 2.2.3 Secondary Research | |
      4. 2.2.4 Primary Research | | |
        1. 2.2.4.1 Primary Interviews and Information Gathering Process | | |
        2. 2.2.4.2 Breakdown of Primary Respondents | |
      5. 2.2.5 Forecasting Model | |
      6. 2.2.6 Market Size Estimation | | |
        1. 2.2.6.1 Bottom-Up Approach | | |
        2. 2.2.6.2 Top-Down Approach | |
      7. 2.2.7 Data Triangulation | |
      8. 2.2.8 Validation 3
  3. SECTION III: QUALITATIVE ANALYSIS |
    1. 3.1 MARKET DYNAMICS | |
      1. 3.1.1 Overview | |
      2. 3.1.2 Drivers | |
      3. 3.1.3 Restraints | |
      4. 3.1.4 Opportunities |
    2. 3.2 MARKET FACTOR ANALYSIS | |
      1. 3.2.1 Value chain Analysis | |
      2. 3.2.2 Porter's Five Forces Analysis | | |
        1. 3.2.2.1 Bargaining Power of Suppliers | | |
        2. 3.2.2.2 Bargaining Power of Buyers | | |
        3. 3.2.2.3 Threat of New Entrants | | |
        4. 3.2.2.4 Threat of Substitutes | | |
        5. 3.2.2.5 Intensity of Rivalry | |
      3. 3.2.3 COVID-19 Impact Analysis | | |
        1. 3.2.3.1 Market Impact Analysis | | |
        2. 3.2.3.2 Regional Impact | | |
        3. 3.2.3.3 Opportunity and Threat Analysis 4
  4. SECTION IV: QUANTITATIVE ANALYSIS |
    1. 4.1 Healthcare, BY Application (USD Billion) | |
      1. 4.1.1 Web Services | |
      2. 4.1.2 Mobile Applications | |
      3. 4.1.3 Cloud Computing | |
      4. 4.1.4 Data Integration | |
      5. 4.1.5 Microservices |
    2. 4.2 Healthcare, BY End Use Industry (USD Billion) | |
      1. 4.2.1 Healthcare | |
      2. 4.2.2 Finance | |
      3. 4.2.3 Retail | |
      4. 4.2.4 Telecommunications | |
      5. 4.2.5 Manufacturing |
    3. 4.3 Healthcare, BY Deployment Model (USD Billion) | |
      1. 4.3.1 On-Premises | |
      2. 4.3.2 Cloud-Based | |
      3. 4.3.3 Hybrid |
    4. 4.4 Healthcare, BY Type of API (USD Billion) | |
      1. 4.4.1 Open API | |
      2. 4.4.2 Internal API | |
      3. 4.4.3 Partner API | |
      4. 4.4.4 Composite API |
    5. 4.5 Healthcare, BY Technology (USD Billion) | |
      1. 4.5.1 RESTful API | |
      2. 4.5.2 SOAP API | |
      3. 4.5.3 GraphQL API | |
      4. 4.5.4 WebSocket API 5
  5. SECTION V: COMPETITIVE ANALYSIS |
    1. 5.1 Competitive Landscape | |
      1. 5.1.1 Overview | |
      2. 5.1.2 Competitive Analysis | |
      3. 5.1.3 Market share Analysis | |
      4. 5.1.4 Major Growth Strategy in the Healthcare | |
      5. 5.1.5 Competitive Benchmarking | |
      6. 5.1.6 Leading Players in Terms of Number of Developments in the Healthcare | |
      7. 5.1.7 Key developments and growth strategies | | |
        1. 5.1.7.1 New Product Launch/Service Deployment | | |
        2. 5.1.7.2 Merger & Acquisitions | | |
        3. 5.1.7.3 Joint Ventures | |
      8. 5.1.8 Major Players Financial Matrix | | |
        1. 5.1.8.1 Sales and Operating Income | | |
        2. 5.1.8.2 Major Players R&D Expenditure. 2023 |
    2. 5.2 Company Profiles | |
      1. 5.2.1 Tata Consultancy Services (IN) | | |
        1. 5.2.1.1 Financial Overview | | |
        2. 5.2.1.2 Products Offered | | |
        3. 5.2.1.3 Key Developments | | |
        4. 5.2.1.4 SWOT Analysis | | |
        5. 5.2.1.5 Key Strategies | |
      2. 5.2.2 Infosys (IN) | | |
        1. 5.2.2.1 Financial Overview | | |
        2. 5.2.2.2 Products Offered | | |
        3. 5.2.2.3 Key Developments | | |
        4. 5.2.2.4 SWOT Analysis | | |
        5. 5.2.2.5 Key Strategies | |
      3. 5.2.3 Wipro (IN) | | |
        1. 5.2.3.1 Financial Overview | | |
        2. 5.2.3.2 Products Offered | | |
        3. 5.2.3.3 Key Developments | | |
        4. 5.2.3.4 SWOT Analysis | | |
        5. 5.2.3.5 Key Strategies | |
      4. 5.2.4 HCL Technologies (IN) | | |
        1. 5.2.4.1 Financial Overview | | |
        2. 5.2.4.2 Products Offered | | |
        3. 5.2.4.3 Key Developments | | |
        4. 5.2.4.4 SWOT Analysis | | |
        5. 5.2.4.5 Key Strategies | |
      5. 5.2.5 Tech Mahindra (IN) | | |
        1. 5.2.5.1 Financial Overview | | |
        2. 5.2.5.2 Products Offered | | |
        3. 5.2.5.3 Key Developments | | |
        4. 5.2.5.4 SWOT Analysis | | |
        5. 5.2.5.5 Key Strategies | |
      6. 5.2.6 Cognizant Technology Solutions (US) | | |
        1. 5.2.6.1 Financial Overview | | |
        2. 5.2.6.2 Products Offered | | |
        3. 5.2.6.3 Key Developments | | |
        4. 5.2.6.4 SWOT Analysis | | |
        5. 5.2.6.5 Key Strategies | |
      7. 5.2.7 Accenture (IE) | | |
        1. 5.2.7.1 Financial Overview | | |
        2. 5.2.7.2 Products Offered | | |
        3. 5.2.7.3 Key Developments | | |
        4. 5.2.7.4 SWOT Analysis | | |
        5. 5.2.7.5 Key Strategies | |
      8. 5.2.8 IBM (US) | | |
        1. 5.2.8.1 Financial Overview | | |
        2. 5.2.8.2 Products Offered | | |
        3. 5.2.8.3 Key Developments | | |
        4. 5.2.8.4 SWOT Analysis | | |
        5. 5.2.8.5 Key Strategies | |
      9. 5.2.9 Oracle (US) | | |
        1. 5.2.9.1 Financial Overview | | |
        2. 5.2.9.2 Products Offered | | |
        3. 5.2.9.3 Key Developments | | |
        4. 5.2.9.4 SWOT Analysis | | |
        5. 5.2.9.5 Key Strategies |
    3. 5.3 Appendix | |
      1. 5.3.1 References | |
      2. 5.3.2 Related Reports 6 LIST OF FIGURES |
    4. 6.1 MARKET SYNOPSIS |
    5. 6.2 INDIA MARKET ANALYSIS BY APPLICATION |
    6. 6.3 INDIA MARKET ANALYSIS BY END USE INDUSTRY |
    7. 6.4 INDIA MARKET ANALYSIS BY DEPLOYMENT MODEL |
    8. 6.5 INDIA MARKET ANALYSIS BY TYPE OF API |
    9. 6.6 INDIA MARKET ANALYSIS BY TECHNOLOGY |
    10. 6.7 KEY BUYING CRITERIA OF HEALTHCARE |
    11. 6.8 RESEARCH PROCESS OF MRFR |
    12. 6.9 DRO ANALYSIS OF HEALTHCARE |
    13. 6.10 DRIVERS IMPACT ANALYSIS: HEALTHCARE |
    14. 6.11 RESTRAINTS IMPACT ANALYSIS: HEALTHCARE |
    15. 6.12 SUPPLY / VALUE CHAIN: HEALTHCARE |
    16. 6.13 HEALTHCARE, BY APPLICATION, 2024 (% SHARE) |
    17. 6.14 HEALTHCARE, BY APPLICATION, 2024 TO 2035 (USD Billion) |
    18. 6.15 HEALTHCARE, BY END USE INDUSTRY, 2024 (% SHARE) |
    19. 6.16 HEALTHCARE, BY END USE INDUSTRY, 2024 TO 2035 (USD Billion) |
    20. 6.17 HEALTHCARE, BY DEPLOYMENT MODEL, 2024 (% SHARE) |
    21. 6.18 HEALTHCARE, BY DEPLOYMENT MODEL, 2024 TO 2035 (USD Billion) |
    22. 6.19 HEALTHCARE, BY TYPE OF API, 2024 (% SHARE) |
    23. 6.20 HEALTHCARE, BY TYPE OF API, 2024 TO 2035 (USD Billion) |
    24. 6.21 HEALTHCARE, BY TECHNOLOGY, 2024 (% SHARE) |
    25. 6.22 HEALTHCARE, BY TECHNOLOGY, 2024 TO 2035 (USD Billion) |
    26. 6.23 BENCHMARKING OF MAJOR COMPETITORS 7 LIST OF TABLES |
    27. 7.1 LIST OF ASSUMPTIONS | |
      1. 7.1.1 |
    28. 7.2 India MARKET SIZE ESTIMATES; FORECAST | |
      1. 7.2.1 BY APPLICATION, 2026-2035 (USD Billion) | |
      2. 7.2.2 BY END USE INDUSTRY, 2026-2035 (USD Billion) | |
      3. 7.2.3 BY DEPLOYMENT MODEL, 2026-2035 (USD Billion) | |
      4. 7.2.4 BY TYPE OF API, 2026-2035 (USD Billion) | |
      5. 7.2.5 BY TECHNOLOGY, 2026-2035 (USD Billion) |
    29. 7.3 PRODUCT LAUNCH/PRODUCT DEVELOPMENT/APPROVAL | |
      1. 7.3.1 |
    30. 7.4 ACQUISITION/PARTNERSHIP | |

India Healthcare Market Segmentation

Healthcare By Application (USD Billion, 2026-2035)

  • Web Services
  • Mobile Applications
  • Cloud Computing
  • Data Integration
  • Microservices

Healthcare By End Use Industry (USD Billion, 2026-2035)

  • Healthcare
  • Finance
  • Retail
  • Telecommunications
  • Manufacturing

Healthcare By Deployment Model (USD Billion, 2026-2035)

  • On-Premises
  • Cloud-Based
  • Hybrid

Healthcare By Type of API (USD Billion, 2026-2035)

  • Open API
  • Internal API
  • Partner API
  • Composite API

Healthcare By Technology (USD Billion, 2026-2035)

  • RESTful API
  • SOAP API
  • GraphQL API
  • WebSocket API

Compare Licence

×
Features License Type
Single User Multiuser License Enterprise User
Price $4,950 $5,950 $7,250
Maximum User Access Limit 1 User Upto 10 Users Unrestricted Access Throughout the Organization
Free Customization
Direct Access to Analyst
Deliverable Format
Platform Access
Discount on Next Purchase 10% 15% 15%
Printable Versions