Immersive Analytics Market (2026 – 2035)

ID: MRFR/ICT/10708-HCR 128 Pages Ankit Gupta Last Updated: September 15, 2026
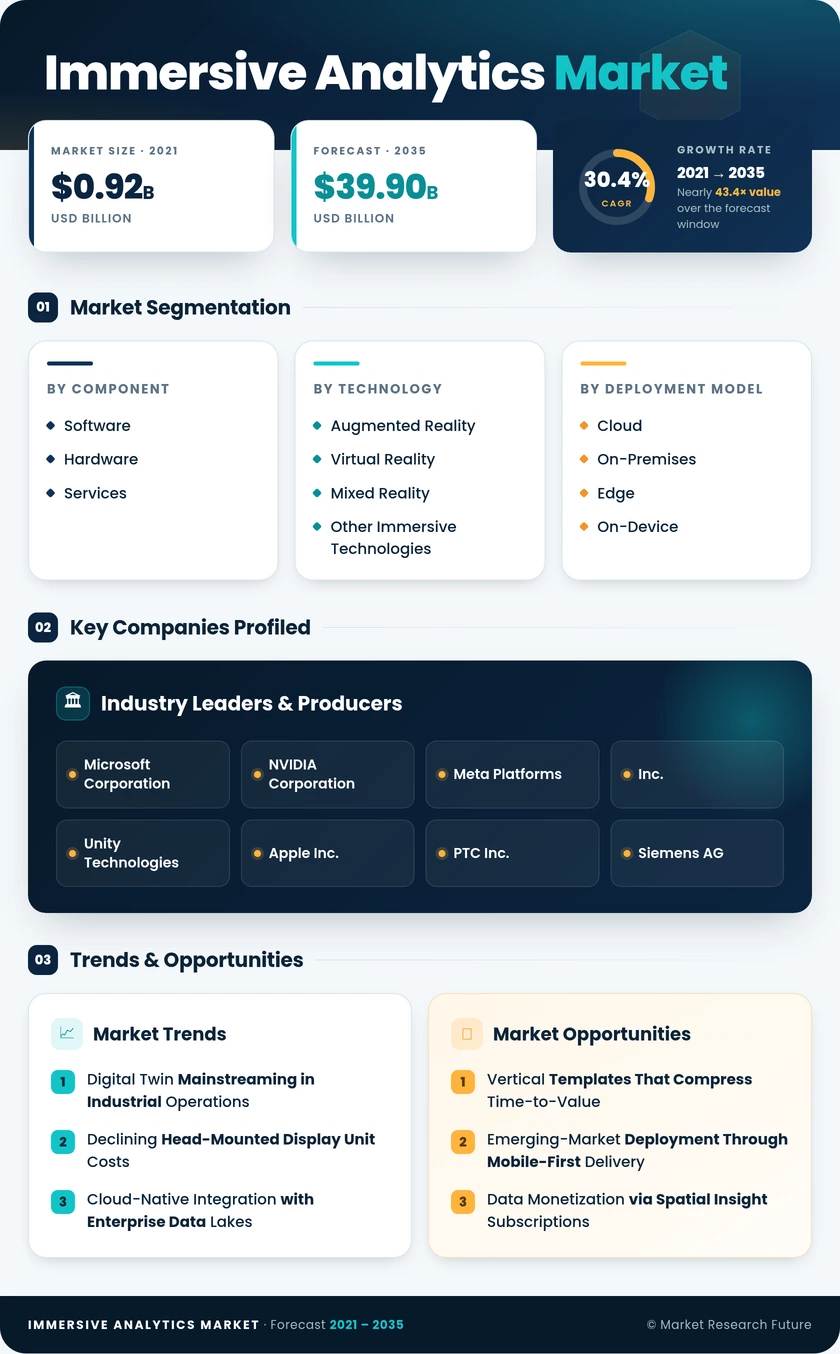
Immersive Analytics Market Size, Share and Research Report By Component (Software, Hardware, Services), By Technology (Augmented Reality, Virtual Reality, Mixed Reality, Other Immersive Technologies), By Deployment Model (Cloud, On-Premises, Edge and On-Device), By Interaction Modality (Gesture-Based, Voice-Based, Eye-Tracking, Haptic, Multimodal Fusion), By End-User Industry (Manufacturing and Industrial, Healthcare and Life Sciences, Retail and E-Commerce, Energy and Utilities, BFSI, Media and Entertainment, Other End-User Industries) and By Regional (North America, Europe, Asia Pacific, South America, Middle East and Africa) - Industry Forecast to 2035.
Immersive Analytics Market
Market Size
Forecast Period2026-2035
CAGR (2026-2035)30.4%
2025 Market SizeUSD 2.81 Billion
2035 Market SizeUSD 39.90 Billion
Key Players
Microsoft Corporation
NVIDIA Corporation
Meta Platforms, Inc.
Unity Technologies
Apple Inc.
PTC Inc.
Opportunities
  • Vertical Templates That Compress Time-to-Value
  • Emerging-Market Deployment Through Mobile-First Delivery
  • Data Monetization via Spatial Insight Subscriptions
  1. 1 Market Summary | |
    1. 1.1 Study Assumptions & Market Definition | |
    2. 1.2 Scope of the Study | |
    3. 1.3 Research Methodology | |
  2. 2 Key Report Takeaways | |
    1. 2.1 By Component | |
    2. 2.2 By Technology | |
    3. 2.3 By Deployment Model | |
    4. 2.4 By Interaction Modality | |
    5. 2.5 By End-User Industry | |
    6. 2.6 By Region | |
  3. 3 Market Size and Forecast (2021–2035) | |
    1. 3.1 Historical Market Size (2021–2024) | |
    2. 3.2 Base Year Assessment (2025) | |
    3. 3.3 Forecast Market Size (2026–2035) | |
    4. 3.4 Year-over-Year Growth Analysis | |
  4. 4 Driver Impact Analysis | |
    1. 4.1 Digital Twin Mainstreaming in Industrial Operations | |
    2. 4.2 Declining Head-Mounted Display Unit Costs | |
    3. 4.3 Cloud-Native Integration with Enterprise Data Lakes | |
    4. 4.4 Open Standards Adoption | |
    5. 4.5 Clinical Training and Surgical Planning Demand | |
    6. 4.6 Private 5G and Edge Compute Build-Out | |
    7. 4.7 Government Industrial Digitization Funding | |
  5. 5 Restraints Impact Analysis | |
    1. 5.1 Headset Ergonomics and Session Fatigue | |
    2. 5.2 Biometric Telemetry Governance and Privacy Rules | |
    3. 5.3 Shortage of Spatial Computing Developers | |
    4. 5.4 Legacy Integration and Pipeline Re-Engineering Cost | |
    5. 5.5 Weak ROI Measurement and Pilot Stagnation | |
  6. 6 Opportunities | |
    1. 6.1 Vertical Templates That Compress Time-to-Value | |
    2. 6.2 Emerging-Market Deployment Through Mobile-First Delivery | |
    3. 6.3 Data Monetization via Spatial Insight Subscriptions | |
    4. 6.4 Regulated-Industry Compliance Workflows | |
    5. 6.5 Collaborative Multi-Site Design Review | |
  7. 7 Regional Market Share and Country-Level Analysis | |
    1. 7.1 North America | | |
      1. 7.1.1 US | | |
      2. 7.1.2 Canada | | |
      3. 7.1.3 Mexico | |
    2. 7.2 Europe | | |
      1. 7.2.1 Germany | | |
      2. 7.2.2 UK | | |
      3. 7.2.3 France | | |
      4. 7.2.4 Italy | | |
      5. 7.2.5 Spain | | |
      6. 7.2.6 Nordic Countries | | |
      7. 7.2.7 Russia | | |
      8. 7.2.8 Rest of Europe | |
    3. 7.3 Asia-Pacific | | |
      1. 7.3.1 China | | |
      2. 7.3.2 India | | |
      3. 7.3.3 Japan | | |
      4. 7.3.4 South Korea | | |
      5. 7.3.5 ASEAN | | |
      6. 7.3.6 Rest of Asia-Pacific | |
    4. 7.4 South America | | |
      1. 7.4.1 Brazil | | |
      2. 7.4.2 Argentina | | |
      3. 7.4.3 Rest of South America | |
    5. 7.5 Middle East & Africa | | |
      1. 7.5.1 Saudi Arabia | | |
      2. 7.5.2 UAE | | |
      3. 7.5.3 South Africa | | |
      4. 7.5.4 Egypt | | |
      5. 7.5.5 Rest of MEA | |
  8. 8 Future Outlook (2026–2035) | |
    1. 8.1 Agentic AI Inside the Scene | |
    2. 8.2 Platform Economics and Consumption Pricing | |
    3. 8.3 Energy and Sustainability Reporting Workflows | |
    4. 8.4 Convergence Toward Device-Agnostic Sessions | |
  9. 9 Segmentation Analysis | |
    1. 9.1 By Component | | |
      1. 9.1.1 Software | | |
      2. 9.1.2 Hardware | | |
      3. 9.1.3 Services | |
    2. 9.2 By Technology | | |
      1. 9.2.1 Augmented Reality | | |
      2. 9.2.2 Virtual Reality | | |
      3. 9.2.3 Mixed Reality | | |
      4. 9.2.4 Other Immersive Technologies | |
    3. 9.3 By Deployment Model | | |
      1. 9.3.1 Cloud | | |
      2. 9.3.2 On-Premises | | |
      3. 9.3.3 Edge and On-Device | |
    4. 9.4 By Interaction Modality | | |
      1. 9.4.1 Gesture-Based | | |
      2. 9.4.2 Voice-Based | | |
      3. 9.4.3 Eye-Tracking | | |
      4. 9.4.4 Haptic | | |
      5. 9.4.5 Multimodal Fusion | |
    5. 9.5 By End-User Industry | | |
      1. 9.5.1 Manufacturing and Industrial | | |
      2. 9.5.2 Healthcare and Life Sciences | | |
      3. 9.5.3 Retail and E-Commerce | | |
      4. 9.5.4 Energy and Utilities | | |
      5. 9.5.5 BFSI | | |
      6. 9.5.6 Media and Entertainment | | |
      7. 9.5.7 Other End-User Industries | |
  10. 10 Competitive Landscape | |
    1. 10.1 Market Concentration Analysis | |
    2. 10.2 Competitive Benchmarking Matrix | |
    3. 10.3 Company Profiles | |
  11. 11 Recent News & Developments | |
  12. 12 Report Scope and Methodology | |
  13. 13 Detailed Sources and Citations | |
  14. 14 Frequently Asked Questions (FAQs) | | LIST OF TABLES | |
  15. TABLE 1 Global Immersive Analytics Market Size & Forecast, by Revenue (USD Billion), 2021–2035 | |
  16. TABLE 2 Global Immersive Analytics Market — Year-over-Year Growth Analysis, 2021–2035 | |
  17. TABLE 3 Driver Impact Analysis — Global Immersive Analytics Market, 2026–2035 | |
  18. TABLE 4 Restraint Impact Analysis — Global Immersive Analytics Market, 2026–2035 | |
  19. TABLE 5 Global Immersive Analytics Market Size, by Region, 2021–2035 (USD Billion) | |
  20. TABLE 6 North America Immersive Analytics Market Size, by Country, 2021–2035 (USD Billion) | |
  21. TABLE 7 Europe Immersive Analytics Market Size, by Country, 2021–2035 (USD Billion) | |
  22. TABLE 8 Asia-Pacific Immersive Analytics Market Size, by Country, 2021–2035 (USD Billion) | |
  23. TABLE 9 South America Immersive Analytics Market Size, by Country, 2021–2035 (USD Billion) | |
  24. TABLE 10 Middle East & Africa Immersive Analytics Market Size, by Country, 2021–2035 (USD Billion) | |
  25. TABLE 11 Global Immersive Analytics Market Size, by Component, 2021–2035 (USD Billion) | |
  26. TABLE 12 Global Immersive Analytics Market Size, by Technology, 2021–2035 (USD Billion) | |
  27. TABLE 13 Global Immersive Analytics Market Size, by Deployment Model, 2021–2035 (USD Billion) | |
  28. TABLE 14 Global Immersive Analytics Market Size, by Interaction Modality, 2021–2035 (USD Billion) | |
  29. TABLE 15 Global Immersive Analytics Market Size, by End-User Industry, 2021–2035 (USD Billion) | |
  30. TABLE 16 North America Immersive Analytics Market Size, by Component, 2021–2035 (USD Billion) | |
  31. TABLE 17 Europe Immersive Analytics Market Size, by Technology, 2021–2035 (USD Billion) | |
  32. TABLE 18 Asia-Pacific Immersive Analytics Market Size, by End-User Industry, 2021–2035 (USD Billion) | |
  33. TABLE 19 Competitive Benchmarking Matrix — Global Immersive Analytics Market, 2026 | |
  34. TABLE 20 Company Profiles — Key Players, Global Immersive Analytics Market | |
  35. TABLE 21 Recent Developments & Strategic Announcements, 2023–2025 | |
  36. TABLE 22 Report Scope & Methodology Summary | |
  37. TABLE 23 Detailed Sources and Citations | | LIST OF FIGURES | |
  38. FIGURE 1 Global Immersive Analytics Market — Market Dynamics Overview | |
  39. FIGURE 2 Global Immersive Analytics Market — Industry Value Chain Analysis | |
  40. FIGURE 3 Global Immersive Analytics Market — Porter's Five Forces Analysis | |
  41. FIGURE 4 Global Immersive Analytics Market Size Trend, 2021–2035 (USD Billion) | |
  42. FIGURE 5 Global Immersive Analytics Market — Year-over-Year Growth Curve, 2022–2035 | |
  43. FIGURE 6 Market Share by Component, 2025 vs 2035 (%) | |
  44. FIGURE 7 Market Share by Technology, 2025 vs 2035 (%) | |
  45. FIGURE 8 Market Share by Deployment Model, 2025 (%) | |
  46. FIGURE 9 Market Share by Interaction Modality, 2025 (%) | |
  47. FIGURE 10 Market Share by End-User Industry, 2025 (%) | |
  48. FIGURE 11 Regional Revenue Share, 2025 (%) | |
  49. FIGURE 12 Regional CAGR Comparison, 2026–2035 (%) | |
  50. FIGURE 13 Country-Level Revenue Contribution — Top 10 Markets, 2025 | |
  51. FIGURE 14 Competitive Landscape — Estimated Revenue Share Ranges, 2026 | |
  52. FIGURE 15 Competitive Positioning Matrix — Capability vs Vertical Depth

Segmentation Quick Reference

DimensionSub-SegmentsDominant SegmentFastest Growing Segment
By ComponentSoftware; Hardware; ServicesSoftware (48.7% share, 2025)Services (30.9% CAGR, 2026–2035)
By TechnologyAugmented Reality; Virtual Reality; Mixed Reality; Other Immersive TechnologiesAugmented Reality (42.1% share, 2025)Mixed Reality (30.7% CAGR, 2026–2035)
By Deployment ModelCloud; On-Premises; Edge and On-DeviceCloud (52.1% share, 2025)Edge and On-Device (30.9% CAGR, 2026–2035)
By Interaction ModalityGesture-Based; Voice-Based; Eye-Tracking; Haptic; Multimodal FusionGesture-Based (32.1% share, 2025)Multimodal Fusion (31.3% CAGR, 2026–2035)
By End-User IndustryManufacturing and Industrial; Healthcare and Life Sciences; Retail and E-Commerce; Energy and Utilities; BFSI; Media and Entertainment; Other End-User IndustriesManufacturing and Industrial (25.1% share, 2025)Healthcare and Life Sciences (31.8% CAGR, 2026–2035)


Market Segmentation Overview

By Component

Sub-SegmentKey Trend
SoftwareLow-code authoring templates and warehouse-native plug-ins lift retention above hardware refresh cycles
HardwareBring-your-own-headset policies shift value away from capital equipment toward optics and sensor differentiation
ServicesSpatial query migration and security hardening engagements expand as production rollouts replace pilots


Software holds the largest component position because vendors ship 3D canvases as extensions to reporting tools already deployed, sparing analysts a tool switch that historically stalled adoption. Services grow fastest since converting relational logic into spatially indexed structures requires scarce specialist labour, and buyers routinely underestimate that workload. Hardware retains a necessary but shrinking share of value as mixed-fleet policies spread and headset procurement moves out of the capital approval cycle entirely.

By Technology

Sub-SegmentKey Trend
Augmented RealityHands-free overlays remain the default for technicians who must retain physical situational awareness
Virtual RealityFully enclosed environments hold their position in surgical and pilot training scenarios
Mixed RealitySensor fusion with equipment twins enables predictive inspection beyond either physical or model view
Other Immersive TechnologiesProjection and volumetric displays serve control-room and shared-review niches


Augmented reality leads on operational practicality: a line worker reading quality metrics still needs to see the machine, which rules out enclosure. Mixed reality advances fastest because combining live thermal or vibration feeds with a synchronized twin exposes failure precursors neither source reveals alone, a capability that regulated maintenance regimes increasingly require. Virtual reality holds steady rather than declining, since distraction-free isolation remains genuinely valuable for high-stakes procedural training.

By Deployment Model

Sub-SegmentKey Trend
CloudElastic GPU capacity absorbs bursty review-session demand without per-seat workstation provisioning
On-PremisesData residency mandates in defence and pharmaceutical manufacturing sustain local clusters
Edge and On-DeviceContainerized lightweight renderers move inference onto factory floors and telecom racks


Cloud remains the majority deployment path because centralized rendering is far cheaper than equipping every seat with capable local hardware. Edge and on-device architectures grow fastest, driven by workloads — defect detection on a moving line, telesurgery guidance, vehicle validation — where a wide-area round trip is disqualifying rather than merely slow. On-premises persists specifically where cross-border data transfer restrictions apply, concentrating in defence programmes and regulated drug production sites.

By Interaction Modality

Sub-SegmentKey Trend
Gesture-BasedController-free hand tracking lowers onboarding friction for first-time enterprise users
Voice-BasedGlove-wearing field crews gain hands-free filtering, though plant noise degrades recognition accuracy
Eye-TrackingFoveated rendering extends untethered battery life while raising biometric governance questions
HapticMid-air tactile pulses confirm selections in precision tasks without visual clutter
Multimodal FusionUnified SDKs coordinate gaze, speech, and gesture streams into single continuous interactions


Gesture-based interaction leads because it needs no accessory and no training, but precision collapses when a user targets one point inside a dense plot. Multimodal fusion grows fastest for exactly that reason: gaze narrows the target, voice applies the filter, and haptic feedback confirms the result, with each channel compensating for another's weakness. Eye-tracking adoption depends heavily on whether the buyer's jurisdiction treats gaze telemetry as regulated biometric data.

By End-User Industry

Sub-SegmentKey Trend
Manufacturing and IndustrialTwin-linked commissioning and inspection deliver measurable rework avoidance
Healthcare and Life SciencesPreoperative planning and clinical training convert from research projects to funded workflows
Retail and E-CommerceSpatial store models test planogram changes before physical aisle resets
Energy and UtilitiesSubstation twins and dispersed asset inspection reduce specialist travel
BFSIMulti-dimensional portfolio risk surfaces support scenario exploration
Media and EntertainmentProduction planning and audience response modelling adopt spatial review
Other End-User IndustriesLogistics slotting, technical education, and public infrastructure programmes expand


Manufacturing and industrial applications anchor demand because plants already produce the dense sensor telemetry that immersive presentation renders legible, and the business case rests on rework and commissioning savings that finance teams can audit. Healthcare and life sciences expand fastest as preoperative 3D planning demonstrates operative time reductions that convert directly into theatre throughput. Retail and e-commerce trail both, adopting spatial layout simulation primarily to avoid the labour cost of physical merchandising trials.




Download PDF ×

We do not share your information with anyone. However, we may send you emails based on your report interest from time to time. You may contact us at any time to opt-out.