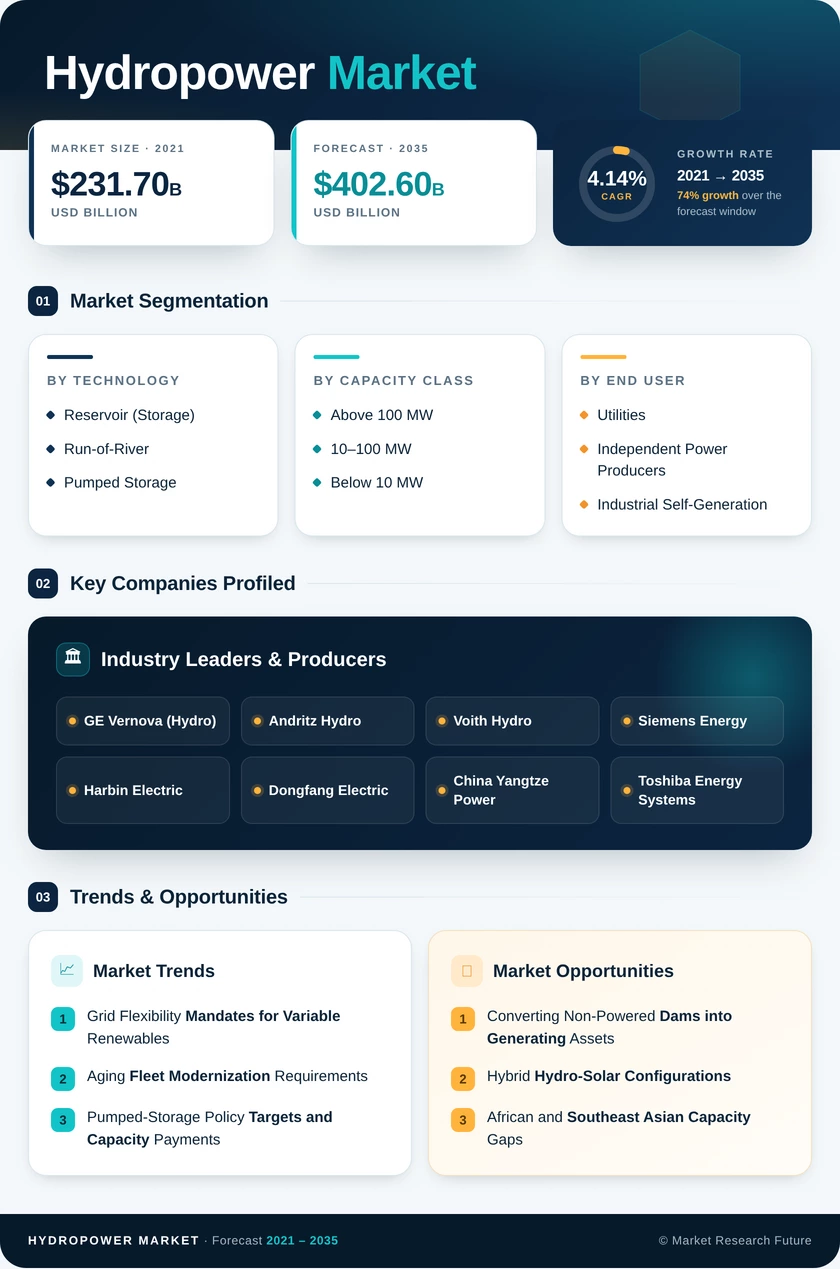
Hydropower Market (2026 - 2035)

ID: MRFR/EnP/2977-CR 116 Pages Anshula Mandaokar Last Updated: October 16, 2026
Hydropower Market Research Report By Technology (Reservoir (Storage), Run-of-River, Pumped Storage), By Capacity Class (Above 100 MW, 10–100 MW, Below 10 MW), By End User (Utilities, Independent Power Producers, Industrial Self-Generation) - Forecast to 2035
Hydropower Market
Market Size
Forecast Period2026-2035
CAGR (2026-2035)4.14%
2025 Market SizeUSD 268.4 Billion
2035 Market SizeUSD 402.6 Billion
Key Players
GE Vernova
Andritz Hydro
Voith Hydro
Siemens Energy
Harbin Electric
Dongfang Electric
Opportunities
  • Converting Non-Powered Dams into Generating Assets
  • Hybrid Hydro-Solar Configurations
  • African and Southeast Asian Capacity Gaps
  1. 1 Market Overview | |
    1. 1.1 Study Assumptions & Market Definition | |
    2. 1.2 Scope of the Study | |
    3. 1.3 Research Methodology | |
  2. 2 Market Summary & Key Takeaways | |
    1. 2.1 Key Takeaways by Technology | |
    2. 2.2 Key Takeaways by Capacity Class | |
    3. 2.3 Key Takeaways by End User | |
    4. 2.4 Key Takeaways by Geography | |
  3. 3 Global Market Size & Forecast (2021–2035) | |
    1. 3.1 Historical Market Size (2021–2025) | |
    2. 3.2 Current & Forecast Market Size (2026–2035) | |
    3. 3.3 Market Size by Revenue (USD Billion) | |
    4. 3.4 Year-over-Year Growth Analysis | |
  4. 4 Market Drivers Analysis | |
    1. 4.1 Grid Flexibility Mandates for Variable Renewables | |
    2. 4.2 Aging Fleet Modernization Requirements | |
    3. 4.3 Pumped-Storage Policy Targets and Capacity Payments | |
    4. 4.4 Corporate 24/7 Carbon-Free Energy Procurement | |
    5. 4.5 Electrification-Led Demand Growth | |
    6. 4.6 Concessional Finance for African Schemes | |
    7. 4.7 Digital Operations and Predictive Maintenance Uptake | |
  5. 5 Market Restraints Analysis | |
    1. 5.1 Permitting and Relicensing Timelines | |
    2. 5.2 Hydrological Variability and Drought Exposure | |
    3. 5.3 Environmental and Social Opposition | |
    4. 5.4 High Upfront Capital Intensity | |
    5. 5.5 Competition from Lithium-Ion Storage Economics | |
  6. 6 Market Opportunity Analysis | |
    1. 6.1 Converting Non-Powered Dams into Generating Assets | |
    2. 6.2 Hybrid Hydro-Solar Configurations | |
    3. 6.3 African and Southeast Asian Capacity Gaps | |
    4. 6.4 Performance-Based Service and Data Monetization Models | |
    5. 6.5 Grid-Services Revenue Stacking | |
    6. 6.6 Industry Value Chain Analysis | |
    7. 6.7 Porter's Five Forces Analysis | |
  7. 7 Regional Analysis | |
    1. 7.1 North America | | |
      1. 7.1.1 United States | | |
      2. 7.1.2 Canada | | |
      3. 7.1.3 Mexico | |
    2. 7.2 Europe | | |
      1. 7.2.1 Germany | | |
      2. 7.2.2 United Kingdom | | |
      3. 7.2.3 France | | |
      4. 7.2.4 Italy | | |
      5. 7.2.5 Spain | | |
      6. 7.2.6 Nordic Countries | | |
      7. 7.2.7 Russia | | |
      8. 7.2.8 Rest of Europe | |
    3. 7.3 Asia-Pacific | | |
      1. 7.3.1 China | | |
      2. 7.3.2 India | | |
      3. 7.3.3 Japan | | |
      4. 7.3.4 South Korea | | |
      5. 7.3.5 ASEAN | | |
      6. 7.3.6 Rest of Asia-Pacific | |
    4. 7.4 South America | | |
      1. 7.4.1 Brazil | | |
      2. 7.4.2 Argentina | | |
      3. 7.4.3 Rest of South America | |
    5. 7.5 Middle East & Africa | | |
      1. 7.5.1 Saudi Arabia | | |
      2. 7.5.2 UAE | | |
      3. 7.5.3 South Africa | | |
      4. 7.5.4 Egypt | | |
      5. 7.5.5 Rest of Middle East & Africa | |
  8. 8 Future Outlook (2026–2035) | |
    1. 8.1 Autonomous and AI-Assisted Plant Operations | |
    2. 8.2 Storage Value Displacing Energy Value | |
    3. 8.3 Climate-Adaptive Design and Hydrology Risk Pricing | |
    4. 8.4 Sustainability Certification as Market Access | |
  9. 9 Segmentation Analysis | |
    1. 9.1 By Technology | | |
      1. 9.1.1 Reservoir (Storage) | | |
      2. 9.1.2 Run-of-River | | |
      3. 9.1.3 Pumped Storage | |
    2. 9.2 By Capacity Class | | |
      1. 9.2.1 Above 100 MW | | |
      2. 9.2.2 10–100 MW | | |
      3. 9.2.3 Below 10 MW | |
    3. 9.3 By End User | | |
      1. 9.3.1 Utilities | | |
      2. 9.3.2 Independent Power Producers | | |
      3. 9.3.3 Industrial Self-Generation | |
  10. 10 Competitive Landscape | |
    1. 10.1 Market Share Analysis (2026) | |
    2. 10.2 Competitive Benchmarking Matrix | |
    3. 10.3 Company Profiles | | |
      1. 10.3.1 GE Vernova (Hydro) | | |
      2. 10.3.2 Andritz Hydro | | |
      3. 10.3.3 Voith Hydro | | |
      4. 10.3.4 Siemens Energy | | |
      5. 10.3.5 Harbin Electric | | |
      6. 10.3.6 Dongfang Electric | | |
      7. 10.3.7 China Yangtze Power | | |
      8. 10.3.8 Toshiba Energy Systems | | |
      9. 10.3.9 Hitachi Energy | | |
      10. 10.3.10 Bharat Heavy Electricals | | |
      11. 10.3.11 Statkraft | | |
      12. 10.3.12 ENGIE | |
  11. 11 Recent Developments & News | |
  12. 12 Report Scope & Methodology | |
    1. 12.1 Study Period & Base Year | |
    2. 12.2 Data Sources & Citations | |
    3. 12.3 Abbreviations | |
  13. 13 Detailed Sources and Citations | |
  14. 14 Frequently Asked Questions (FAQs) | | LIST OF TABLES | |
  15. TABLE 1 Global Hydropower Market Size & Forecast, by Revenue (USD Billion), 2021–2035 | |
  16. TABLE 2 Global Hydropower Market – Year-over-Year Growth Analysis, 2021–2035 | |
  17. TABLE 3 Global Hydropower Market – Driver Impact Analysis, 2026–2035 | |
  18. TABLE 4 Global Hydropower Market – Restraint Impact Analysis, 2026–2035 | |
  19. TABLE 5 Global Hydropower Market Size, by Region, 2021–2035 (USD Billion) | |
  20. TABLE 6 North America Hydropower Market Size, by Country, 2021–2035 (USD Billion) | |
  21. TABLE 7 Europe Hydropower Market Size, by Country, 2021–2035 (USD Billion) | |
  22. TABLE 8 Asia-Pacific Hydropower Market Size, by Country, 2021–2035 (USD Billion) | |
  23. TABLE 9 South America Hydropower Market Size, by Country, 2021–2035 (USD Billion) | |
  24. TABLE 10 Middle East & Africa Hydropower Market Size, by Country, 2021–2035 (USD Billion) | |
  25. TABLE 11 Global Hydropower Market Size, by Technology, 2021–2035 (USD Billion) | |
  26. TABLE 12 Global Hydropower Market Size, by Capacity Class, 2021–2035 (USD Billion) | |
  27. TABLE 13 Global Hydropower Market Size, by End User, 2021–2035 (USD Billion) | |
  28. TABLE 14 North America Hydropower Market Size, by Technology, 2021–2035 (USD Billion) | |
  29. TABLE 15 North America Hydropower Market Size, by Capacity Class, 2021–2035 (USD Billion) | |
  30. TABLE 16 North America Hydropower Market Size, by End User, 2021–2035 (USD Billion) | |
  31. TABLE 17 Europe Hydropower Market Size, by Technology, 2021–2035 (USD Billion) | |
  32. TABLE 18 Europe Hydropower Market Size, by Capacity Class, 2021–2035 (USD Billion) | |
  33. TABLE 19 Europe Hydropower Market Size, by End User, 2021–2035 (USD Billion) | |
  34. TABLE 20 Asia-Pacific Hydropower Market Size, by Technology, 2021–2035 (USD Billion) | |
  35. TABLE 21 Asia-Pacific Hydropower Market Size, by Capacity Class, 2021–2035 (USD Billion) | |
  36. TABLE 22 Asia-Pacific Hydropower Market Size, by End User, 2021–2035 (USD Billion) | |
  37. TABLE 23 South America Hydropower Market Size, by Technology, 2021–2035 (USD Billion) | |
  38. TABLE 24 South America Hydropower Market Size, by Capacity Class, 2021–2035 (USD Billion) | |
  39. TABLE 25 South America Hydropower Market Size, by End User, 2021–2035 (USD Billion) | |
  40. TABLE 26 Middle East & Africa Hydropower Market Size, by Technology, 2021–2035 (USD Billion) | |
  41. TABLE 27 Middle East & Africa Hydropower Market Size, by Capacity Class, 2021–2035 (USD Billion) | |
  42. TABLE 28 Middle East & Africa Hydropower Market Size, by End User, 2021–2035 (USD Billion) | |
  43. TABLE 29 United States Hydropower Market Size, by Technology, 2021–2035 (USD Billion) | |
  44. TABLE 30 Canada Hydropower Market Size, by Technology, 2021–2035 (USD Billion) | |
  45. TABLE 31 China Hydropower Market Size, by Technology, 2021–2035 (USD Billion) | |
  46. TABLE 32 India Hydropower Market Size, by Technology, 2021–2035 (USD Billion) | |
  47. TABLE 33 Brazil Hydropower Market Size, by Technology, 2021–2035 (USD Billion) | |
  48. TABLE 34 Competitive Benchmarking Matrix – Global Hydropower Market, 2026 | |
  49. TABLE 35 Company Profiles – Key Players, Global Hydropower Market | |
  50. TABLE 36 Recent Developments & Strategic Announcements, 2023–2025 | |
  51. TABLE 37 Report Scope & Methodology Summary | |
  52. TABLE 38 Detailed Sources and Citations Index | | LIST OF FIGURES | |
  53. FIGURE 1 Global Hydropower Market – Market Dynamics Overview | |
  54. FIGURE 2 Global Hydropower Market – Industry Value Chain Analysis | |
  55. FIGURE 3 Global Hydropower Market – Porter's Five Forces Analysis | |
  56. FIGURE 4 Global Hydropower Market Size Trend, 2021–2035 (USD Billion) | |
  57. FIGURE 5 Global Hydropower Market – Year-over-Year Growth Trend, 2022–2035 | |
  58. FIGURE 6 Global Hydropower Market Share, by Technology, 2025 vs 2035 | |
  59. FIGURE 7 Global Hydropower Market Share, by Capacity Class, 2025 vs 2035 | |
  60. FIGURE 8 Global Hydropower Market Share, by End User, 2025 vs 2035 | |
  61. FIGURE 9 Global Hydropower Market Share, by Region, 2025 | |
  62. FIGURE 10 Regional CAGR Comparison, 2026–2035 | |
  63. FIGURE 11 North America Hydropower Market – Country Share Breakdown, 2025 | |
  64. FIGURE 12 Europe Hydropower Market – Country Share Breakdown, 2025 | |
  65. FIGURE 13 Asia-Pacific Hydropower Market – Country Share Breakdown, 2025 | |
  66. FIGURE 14 South America Hydropower Market – Country Share Breakdown, 2025 | |
  67. FIGURE 15 Middle East & Africa Hydropower Market – Country Share Breakdown, 2025 | |
  68. FIGURE 16 Competitive Landscape – Estimated Supplier Share Ranges, 2026 | |
  69. FIGURE 17 Competitive Positioning Matrix – Capability vs Global Reach | |
  70. FIGURE 18 Driver and Restraint Impact Weighting Chart

Segmentation Quick Reference

DimensionSub-SegmentsDominant SegmentFastest Growing Segment
By TechnologyReservoir (Storage), Run-of-River, Pumped StorageReservoir (Storage)Pumped Storage
By Capacity ClassAbove 100 MW, 10–100 MW, Below 10 MWAbove 100 MWBelow 10 MW
By End UserUtilities, Independent Power Producers, Industrial Self-GenerationUtilitiesIndependent Power Producers
By GeographyNorth America, Europe, Asia-Pacific, South America, Middle East & AfricaAsia-PacificMiddle East & Africa


Market Segmentation Overview

By Technology

Sub-SegmentKey Trend
Reservoir (Storage)Seasonal storage value rising as thermal capacity retires; drawdown flexibility being re-engineered for wider operating ranges
Run-of-RiverPreferred where permitting is constrained; cascade automation improving aggregate dispatch coordination
Pumped StorageCapacity-payment frameworks in China, India, and Europe converting merchant risk into contracted revenue


Technology mix is shifting toward assets valued for flexibility rather than energy volume. Reservoir plants retain the largest share because storage capability is difficult to replicate, while pumped storage grows fastest on the back of explicit national targets. Run-of-river remains the pragmatic choice in geographies where impoundment is politically or environmentally infeasible.

By Capacity Class

Sub-SegmentKey Trend
Above 100 MWConcentrated in China, Brazil, and Canada; modernization spend increasingly exceeds greenfield in OECD markets
10–100 MWRegional grid supply and industrial offtake; attractive to independent producers on shorter build cycles
Below 10 MWFastest growth from rural electrification and standardized compact turbine-generator packages


Scale economics still favour large installations for absolute value, but growth momentum sits at the small end. Below-10 MW projects avoid the resettlement, sediment, and relicensing obligations that add years to large schemes, and standardized equipment has compressed both cost and delivery time across Asian and African deployments.

By End User

Sub-SegmentKey Trend
UtilitiesRate-based fleet renewal driven by dam safety obligations and reliability mandates
Independent Power ProducersCorporate offtake and capacity-market revenue creating contracted opportunities outside regulated frameworks
Industrial Self-GenerationAluminium and mining incumbents joined by data-center operators pursuing hourly carbon matching


Ownership economics are diverging. Utilities invest to maintain regulated asset bases and meet reliability obligations, while independent producers chase the newer revenue stacks emerging from ancillary services and corporate procurement. Industrial self-generation is being revitalized by hyperscale computing demand for firm, hourly-matched clean power.

By Geography

Sub-SegmentKey Trend
North AmericaRelicensing backlog paces capital deployment; non-powered dam conversion emerging as the shovel-ready niche
EuropeFlexibility procurement and river restoration obligations shaping investment toward reversible plant conversion
Asia-PacificChinese pumped-storage targets and Indian transmission waivers anchoring the global project pipeline
South AmericaDrought resilience and firm-capacity auction design dominating investment logic
Middle East & AfricaConcessional and blended finance unlocking large schemes on the Nile, Congo, and Zambezi


Regional divergence is structural rather than cyclical. Mature markets spend on extending and upgrading existing assets under tightening environmental constraints, while emerging markets add capacity where resource potential remains largely undeveloped and multilateral finance bridges the cost-of-capital gap.




Download PDF ×

We do not share your information with anyone. However, we may send you emails based on your report interest from time to time. You may contact us at any time to opt-out.