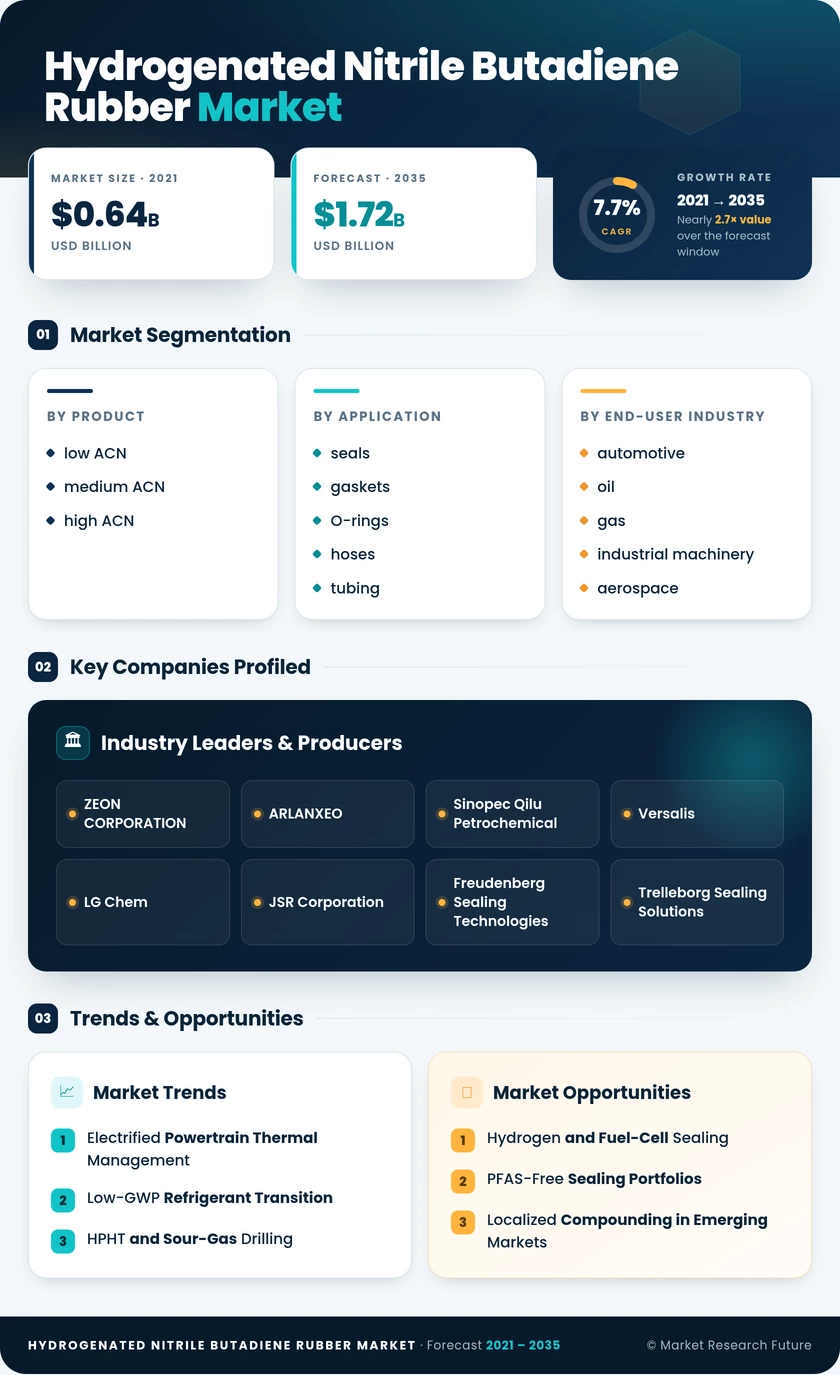
Hydrogenated Nitrile Butadiene Rubber Market (2026 - 2035)

ID: MRFR/CnM/5563-CR 163 Pages Chitranshi Jaiswal Last Updated: November 17, 2026
Hydrogenated Nitrile Butadiene Rubber Market Research Report Information By Product (Low ACN: Less Than 30%, Medium ACN: 31–40%, and High ACN: More Than 40%), By Application (Seals and Gaskets, O-Rings, Hoses and Tubing, Belts, Wire and Cable Ins
Hydrogenated Nitrile Butadiene Rubber Market
Market Size
Forecast Period2026-2035
CAGR (2026-2035)7.7%
2025 Market SizeUSD 0.83 Billion
2035 Market SizeUSD 1.72 Billion
Key Players
ZEON CORPORATION
ARLANXEO
Sinopec Qilu Petrochemical
Versalis
LG Chem
JSR Corporation
Opportunities
  • Hydrogen and Fuel-Cell Sealing
  • PFAS-Free Sealing Portfolios
  • Localized Compounding in Emerging Markets
  1. 1 Market Summary | |
  2. 2 Key Report Takeaways | |
    1. 2.1 By Product | |
    2. 2.2 By Application | |
    3. 2.3 By End-user Industry | |
    4. 2.4 By Region | |
  3. 3 Market Size and Forecast (2021–2035) | |
    1. 3.1 Historical Market Size (2021–2024) | |
    2. 3.2 Base Year Market Size (2025) | |
    3. 3.3 Forecast Market Size (2026–2035) | |
    4. 3.4 Year-over-Year Growth Analysis | |
  4. 4 Driver Impact Analysis | |
    1. 4.1 Electrified Powertrain Thermal Management | |
    2. 4.2 Low-GWP Refrigerant Transition | |
    3. 4.3 HPHT and Sour-Gas Drilling | |
    4. 4.4 CCUS and Hydrogen Infrastructure | |
    5. 4.5 PFAS Restriction and FKM Substitution | |
    6. 4.6 Medical and Pharmaceutical Processing Seals | |
    7. 4.7 Aerospace and Industrial Hydraulics | |
  5. 5 Restraints Impact Analysis | |
    1. 5.1 Price Premium Over NBR and EPDM | |
    2. 5.2 Concentrated Hydrogenation Capacity | |
    3. 5.3 Acrylonitrile and Butadiene Feedstock Volatility | |
    4. 5.4 Competition From Alternative Elastomers | |
    5. 5.5 Decline in Combustion-Engine Seal Content | |
  6. 6 Opportunities | |
    1. 6.1 Hydrogen and Fuel-Cell Sealing | |
    2. 6.2 PFAS-Free Sealing Portfolios | |
    3. 6.3 Localized Compounding in Emerging Markets | |
    4. 6.4 Data-Driven Service Models | |
    5. 6.5 Bio-Attributed and Circular Grades | |
  7. 7 Regional Market Share and Country-Level Analysis | |
    1. 7.1 North America | | |
      1. 7.1.1 United States | | |
      2. 7.1.2 Canada | | |
      3. 7.1.3 Mexico | |
    2. 7.2 Europe | | |
      1. 7.2.1 Germany | | |
      2. 7.2.2 UK | | |
      3. 7.2.3 France | | |
      4. 7.2.4 Italy | | |
      5. 7.2.5 Spain | | |
      6. 7.2.6 Nordic Countries | | |
      7. 7.2.7 Russia | | |
      8. 7.2.8 Rest of Europe | |
    3. 7.3 Asia-Pacific | | |
      1. 7.3.1 China | | |
      2. 7.3.2 India | | |
      3. 7.3.3 Japan | | |
      4. 7.3.4 South Korea | | |
      5. 7.3.5 ASEAN | | |
      6. 7.3.6 Rest of Asia-Pacific | |
    4. 7.4 South America | | |
      1. 7.4.1 Brazil | | |
      2. 7.4.2 Argentina | | |
      3. 7.4.3 Rest of South America | |
    5. 7.5 Middle East & Africa | | |
      1. 7.5.1 Saudi Arabia | | |
      2. 7.5.2 UAE | | |
      3. 7.5.3 South Africa | | |
      4. 7.5.4 Egypt | | |
      5. 7.5.5 Rest of MEA | |
  8. 8 Future Outlook (2026–2035) | |
    1. 8.1 Electrification Supercycle | |
    2. 8.2 Fluorine-Free Design Becomes Default | |
    3. 8.3 Energy-Transition Infrastructure | |
    4. 8.4 AI-Assisted Formulation and ESG Disclosure | |
  9. 9 Segmentation Analysis | |
    1. 9.1 By Product | | |
      1. 9.1.1 low ACN | | |
      2. 9.1.2 medium ACN | | |
      3. 9.1.3 high ACN | |
    2. 9.2 By Application | | |
      1. 9.2.1 seals and gaskets | | |
      2. 9.2.2 O-rings | | |
      3. 9.2.3 Hoses and tubing | | |
      4. 9.2.4 belts | | |
      5. 9.2.5 wire and cable insulation | | |
      6. 9.2.6 rollers and others | |
    3. 9.3 By End-user Industry | | |
      1. 9.3.1 automotive | | |
      2. 9.3.2 Oil and gas | | |
      3. 9.3.3 Industrial machinery | | |
      4. 9.3.4 aerospace | | |
      5. 9.3.5 Medical devices | | |
      6. 9.3.6 Other end-user industries | |
  10. 10 Competitive Landscape | |
    1. 10.1 Market Concentration Analysis | |
    2. 10.2 Competitive Benchmarking Matrix | |
    3. 10.3 Company Profiles | | |
      1. 10.3.1 ZEON CORPORATION | | |
      2. 10.3.2 ARLANXEO | | |
      3. 10.3.3 Sinopec Qilu Petrochemical | | |
      4. 10.3.4 Versalis | | |
      5. 10.3.5 Denka Company Limited | | |
      6. 10.3.6 LG Chem | | |
      7. 10.3.7 JSR Corporation | | |
      8. 10.3.8 Freudenberg Sealing Technologies | | |
      9. 10.3.9 Trelleborg Sealing Solutions | | |
      10. 10.3.10 NOK Corporation | |
  11. 11 Recent News & Developments | |
  12. 12 Report Scope and Methodology | |
  13. 13 Detailed Sources and Citations | |
  14. 14 Frequently Asked Questions (FAQs) | | LIST OF TABLES | |
  15. TABLE 1 Global HNBR Market Snapshot, 2025 and 2035 | |
  16. TABLE 2 Global HNBR Market Size & Forecast, by Revenue (USD Billion), 2021–2035 | |
  17. TABLE 3 Driver Impact Analysis, 2026–2035 | |
  18. TABLE 4 Restraints Impact Analysis, 2026–2035 | |
  19. TABLE 5 Global HNBR Market, Regional Summary, 2025 | |
  20. TABLE 6 North America HNBR Market, by Country, 2025 | |
  21. TABLE 7 Europe HNBR Market, by Country, 2025 | |
  22. TABLE 8 Asia-Pacific HNBR Market, by Country, 2025 | |
  23. TABLE 9 South America HNBR Market, by Country, 2025 | |
  24. TABLE 10 Middle East & Africa HNBR Market, by Country, 2025 | |
  25. TABLE 11 Global HNBR Market, by Product, 2025 | |
  26. TABLE 12 Global HNBR Market, by Application, 2025 | |
  27. TABLE 13 Global HNBR Market, by End-user Industry, 2025 | |
  28. TABLE 14 Competitive Benchmarking Matrix, Global HNBR Market | |
  29. TABLE 15 Report Scope and Methodology | |
  30. TABLE 16 Detailed Sources and Citations | |
  31. TABLE 17 Segmentation Quick Reference | | LIST OF FIGURES | |
  32. FIGURE 1 Global HNBR Market Dynamics Overview | |
  33. FIGURE 2 HNBR Industry Value Chain Analysis | |
  34. FIGURE 3 Porter's Five Forces Analysis, Global HNBR Market | |
  35. FIGURE 4 Global HNBR Market Size Trend (USD Billion), 2021–2035 | |
  36. FIGURE 5 Global HNBR Market Share, by Product, 2025 | |
  37. FIGURE 6 Global HNBR Market Share, by Application, 2025 | |
  38. FIGURE 7 Global HNBR Market Share, by End-user Industry, 2025 | |
  39. FIGURE 8 Global HNBR Market Share, by Region, 2025 | |
  40. FIGURE 9 Country-Level Share Comparison, by Region, 2025 | |
  41. FIGURE 10 Global HNBR Market Concentration and Competitive Share, 2025 | |
  42. FIGURE 11 Competitive Positioning Matrix, Key Players

Segmentation Quick Reference

DimensionSub-SegmentsDominant SegmentFastest Growing Segment
By Productlow ACN; medium ACN; high ACNhigh ACN (49.2% share)low ACN (9.1% CAGR)
By Applicationseals and gaskets; O-rings; hoses and tubing; belts; wire and cable insulation; rollers and othersseals and gaskets (39.6% share)hoses and tubing (8.8% CAGR)
By End-user Industryautomotive; oil and gas; industrial machinery; aerospace; medical devices; other end-user industriesautomotive (51.6% share)medical devices (9.3% CAGR)
By RegionNorth America; Europe; Asia-Pacific; South America; Middle East & AfricaAsia-Pacific (44.6% share)Middle East & Africa (9.1% CAGR)

Market Segmentation Overview

By Product

Sub-SegmentKey Trend
low ACNFunctionalized grades extend cold flexibility toward −40 °C
medium ACNGaining use in glycol-compatible EV coolant hoses
high ACNDefault choice for fuel-system and sour-service seals

High ACN grades lead because hydrocarbon-wetted fuel, hydraulic and wellhead parts need maximum polarity and sour-gas qualification. Low ACN grades grow fastest as new functionalized chemistries reach cold-climate performance once limited to fluorosilicones. Medium ACN sits between the two and is winning EV coolant hose specifications where glycol resistance and processability both matter.

By Application

Sub-SegmentKey Trend
seals and gasketsPFAS policy drives FKM-to-HNBR conversion below 150 °C
O-ringsSteady hydraulic and aerospace replacement demand
hoses and tubingEV battery cooling and R1234yf requalification
beltsTiming and auxiliary belts for hybrid engines
Wire and cable insulationSubsea umbilical and downhole logging niches
Rollers and othersIndustrial printing and steel-mill rollers

Seals and gaskets lead because almost every oil-wetted joint in engines, hydraulics and wellheads specifies HNBR for chemical and thermal resilience. Hoses and tubing grow fastest as battery cooling circuits and low-GWP refrigerant systems require new, compatible hose constructions. Belts remain tied to hybrid engine timing systems and will decline as battery-electric share rises.

By End-user Industry

Sub-SegmentKey Trend
automotiveShift from engine seals to thermal-management parts
oil and gasHPHT and sour-gas qualification demand
industrial machineryLong-interval hydraulic sealing
aerospaceActuator and fuel-system seals for fleet growth
medical devicesFDA-compliant sterilizable compounds
Other end-user industriesFood processing and printing applications

Automotive leads because hybrid and plug-in vehicles still carry engine seals while adding battery thermal hardware. Medical devices grow fastest as bioprocess gaskets and minimally invasive instruments adopt FDA-compliant compounds that withstand repeated steam sterilization. Oil and gas remains the second-largest buyer, driven by sour-gas and HPHT well programmes that standard nitrile cannot serve.


Download PDF ×

We do not share your information with anyone. However, we may send you emails based on your report interest from time to time. You may contact us at any time to opt-out.