Hydrogen Fuel Cell Vehicle (HFCV) Market (2026 - 2035)

ID: MRFR/AT/3300-HCR 200 Pages Triveni Bhoyar Last Updated: November 12, 2026
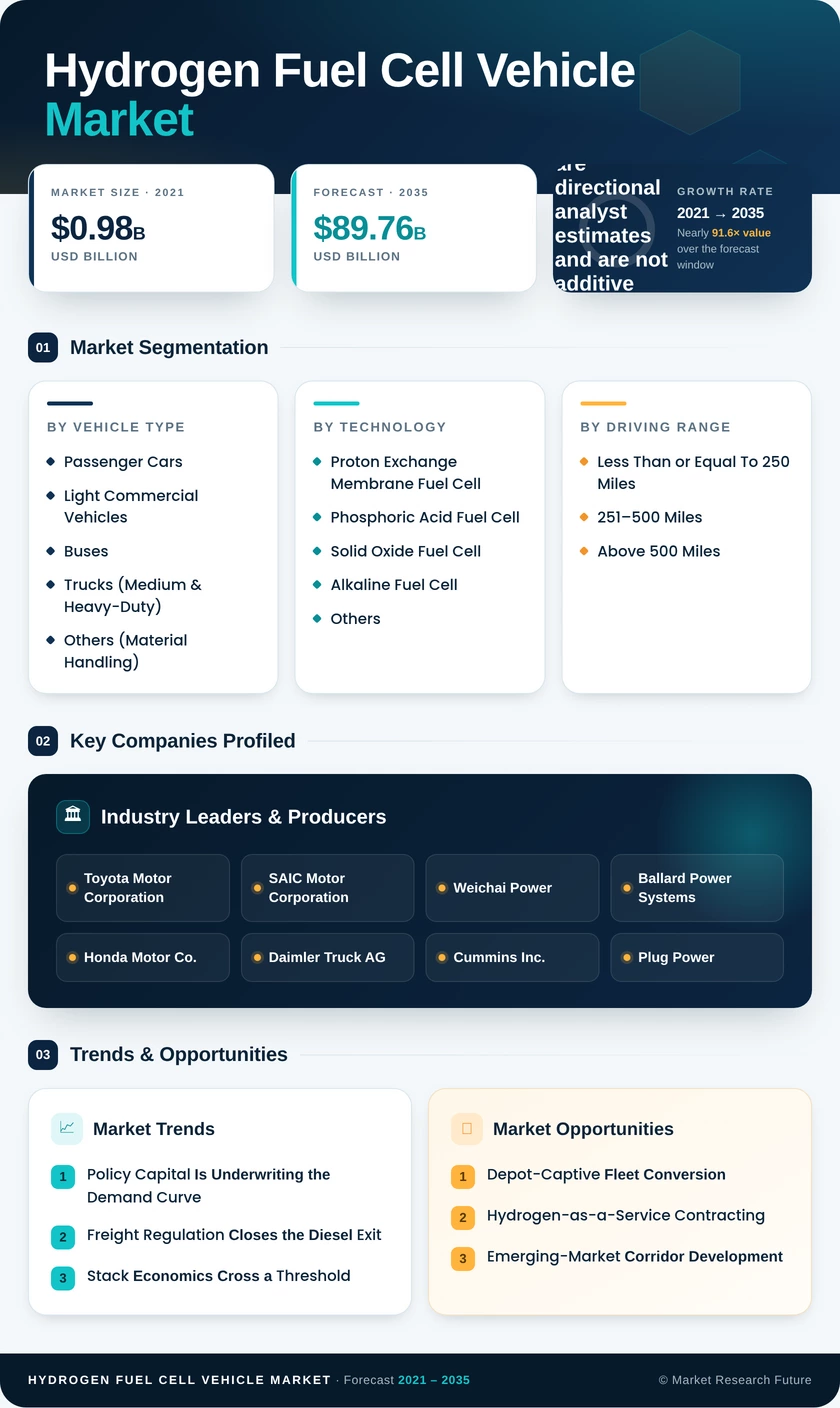
Hydrogen Fuel Cell Vehicle (HFCV) Market Research Report By Vehicle Type (Passenger Cars, Light Commercial Vehicles, Buses, Trucks (Medium & Heavy-Duty), Others (Material Handling)), By Technology (Proton Exchange Membrane Fuel Cell, Phosphoric Acid Fuel Cell, Solid Oxide Fuel Cell, Alkaline Fuel Cell, Others), By Driving Range (Less Than or Equal To 250 Miles, 251–500 Miles, Above 500 Miles), By Power Output (Less Than 100 kW, 100–200 kW, Above 200 kW), By End-Use Ownership (Private / Personal, Commercial Fleet, Public Transport / Government) and By Regional (North America, Europe, South America, Asia Pacific, Middle East and Africa) - Growth & Industry Forecast to 2035
Hydrogen Fuel Cell Vehicle (HFCV) Market
Market Size
Forecast Period2026-2035
CAGR (2026-2035)39.8%
2025 Market SizeUSD 3.22 Billion
2035 Market SizeUSD 89.76 Billion
Key Players
Toyota Motor Corporation
SAIC Motor Corporation
Weichai Power
Ballard Power Systems
Honda Motor Co.
Daimler Truck AG
Opportunities
  • Depot-Captive Fleet Conversion
  • Hydrogen-as-a-Service Contracting
  • Emerging-Market Corridor Development
  1. 1 Market Overview |
    1. 1.1 Study Assumptions & Market Definition |
    2. 1.2 Scope of the Study |
    3. 1.3 Research Methodology
  2. 2 Market Summary & Key Takeaways
  3. 3 Market Dynamics |
    1. 3.1 Market Drivers Analysis | |
      1. 3.1.1 National Hydrogen Strategies & Capital Subsidies | |
      2. 3.1.2 Heavy-Duty Freight Decarbonization Mandates | |
      3. 3.1.3 Refuelling Infrastructure Buildout | |
      4. 3.1.4 Fuel Cell Stack Cost Declines | |
      5. 3.1.5 Public Transit Procurement Cycles | |
      6. 3.1.6 Green Hydrogen Production Scale-Up | |
      7. 3.1.7 Corporate Fleet Emissions Commitments |
    2. 3.2 Market Restraints Analysis | |
      1. 3.2.1 Elevated Retail Hydrogen Pricing | |
      2. 3.2.2 Sparse and Unreliable Refuelling Networks | |
      3. 3.2.3 Battery-Electric Cost and Efficiency Competition | |
      4. 3.2.4 Platinum Group Metal Supply Concentration | |
      5. 3.2.5 Carbon-Intensity Scrutiny of Grey Hydrogen |
    3. 3.3 Market Opportunity Analysis | |
      1. 3.3.1 Depot-Captive Fleet Conversion | |
      2. 3.3.2 Hydrogen-as-a-Service Contracting | |
      3. 3.3.3 Emerging-Market Corridor Development | |
      4. 3.3.4 Telematics and Stack-Health Data Monetization | |
      5. 3.3.5 Material Handling and Off-Highway Spillover |
    4. 3.4 Industry Value Chain Analysis |
    5. 3.5 Porter's Five Forces Analysis
  4. 4 Global Market Size & Forecast (2021–2035) |
    1. 4.1 Historical Market Size (2021–2025) |
    2. 4.2 Current & Forecast Market Size (2026–2035) |
    3. 4.3 Market Size by Revenue (USD Billion) |
    4. 4.4 Year-over-Year Growth Analysis
  5. 5 Segmentation Analysis |
    1. 5.1 By Vehicle Type | |
      1. 5.1.1 Passenger Cars | |
      2. 5.1.2 Light Commercial Vehicles | |
      3. 5.1.3 Buses | |
      4. 5.1.4 Trucks (Medium & Heavy-Duty) | |
      5. 5.1.5 Others (Material Handling) |
    2. 5.2 By Technology | |
      1. 5.2.1 Proton Exchange Membrane Fuel Cell | |
      2. 5.2.2 Phosphoric Acid Fuel Cell | |
      3. 5.2.3 Solid Oxide Fuel Cell | |
      4. 5.2.4 Alkaline Fuel Cell | |
      5. 5.2.5 Others |
    3. 5.3 By Driving Range | |
      1. 5.3.1 Less Than or Equal To 250 Miles | |
      2. 5.3.2 251–500 Miles | |
      3. 5.3.3 Above 500 Miles |
    4. 5.4 By Power Output | |
      1. 5.4.1 Less Than 100 kW | |
      2. 5.4.2 100–200 kW | |
      3. 5.4.3 Above 200 kW |
    5. 5.5 By End-Use Ownership | |
      1. 5.5.1 Private / Personal | |
      2. 5.5.2 Commercial Fleet | |
      3. 5.5.3 Public Transport / Government
  6. 6 Regional Analysis |
    1. 6.1 North America | |
      1. 6.1.1 US | |
      2. 6.1.2 Canada | |
      3. 6.1.3 Mexico |
    2. 6.2 Europe | |
      1. 6.2.1 Germany | |
      2. 6.2.2 UK | |
      3. 6.2.3 France | |
      4. 6.2.4 Italy | |
      5. 6.2.5 Spain | |
      6. 6.2.6 Nordic Countries | |
      7. 6.2.7 Russia | |
      8. 6.2.8 Rest of Europe |
    3. 6.3 Asia-Pacific | |
      1. 6.3.1 China | |
      2. 6.3.2 India | |
      3. 6.3.3 Japan | |
      4. 6.3.4 South Korea | |
      5. 6.3.5 ASEAN | |
      6. 6.3.6 Rest of Asia-Pacific |
    4. 6.4 South America | |
      1. 6.4.1 Brazil | |
      2. 6.4.2 Argentina | |
      3. 6.4.3 Rest of South America |
    5. 6.5 Middle East & Africa | |
      1. 6.5.1 Saudi Arabia | |
      2. 6.5.2 UAE | |
      3. 6.5.3 South Africa | |
      4. 6.5.4 Egypt | |
      5. 6.5.5 Rest of Middle East & Africa
  7. 7 Competitive Landscape |
    1. 7.1 Market Share Analysis (2026) |
    2. 7.2 Competitive Benchmarking Matrix |
    3. 7.3 Company Profiles | |
      1. 7.3.1 Toyota Motor Corporation | |
      2. 7.3.2 Hyundai Motor Company | |
      3. 7.3.3 SAIC Motor Corporation | |
      4. 7.3.4 Weichai Power | |
      5. 7.3.5 Ballard Power Systems | |
      6. 7.3.6 Honda Motor Co. | |
      7. 7.3.7 Daimler Truck AG | |
      8. 7.3.8 Cummins Inc. | |
      9. 7.3.9 Plug Power | |
      10. 7.3.10 Yutong Bus | |
      11. 7.3.11 Foton Motor
  8. 8 Future Outlook & Strategic Recommendations (2026–2035) |
    1. 8.1 Near-Term Outlook (2026–2028) |
    2. 8.2 Medium-Term Outlook (2029–2031) |
    3. 8.3 Long-Term Outlook (2032–2035)
  9. 9 Recent Developments & News
  10. 10 Frequently Asked Questions (FAQs)
  11. 11 Report Scope & Methodology |
    1. 11.1 Study Period & Base Year |
    2. 11.2 Data Sources & Citations |
    3. 11.3 Abbreviations
  12. 12 LIST OF TABLES
  13. 13 LIST OF FIGURES

Segmentation Quick Reference

DimensionSub-SegmentsDominant SegmentFastest Growing Segment
By Vehicle TypePassenger Cars; Light Commercial Vehicles; Buses; Trucks (Medium & Heavy-Duty); Others (Material Handling)Passenger CarsTrucks (Medium & Heavy-Duty)
By TechnologyProton Exchange Membrane Fuel Cell; Phosphoric Acid Fuel Cell; Solid Oxide Fuel Cell; Alkaline Fuel Cell; OthersProton Exchange Membrane Fuel CellSolid Oxide Fuel Cell
By Driving RangeLess Than or Equal To 250 Miles; 251–500 Miles; Above 500 Miles251–500 MilesAbove 500 Miles
By Power OutputLess Than 100 kW; 100–200 kW; Above 200 kW100–200 kWAbove 200 kW
By End-Use OwnershipPrivate / Personal; Commercial Fleet; Public Transport / GovernmentPrivate / PersonalCommercial Fleet
By RegionNorth America; Europe; Asia-Pacific; South America; Middle East & AfricaAsia-PacificAsia-Pacific


Market Segmentation Overview

By Vehicle Type

Sub-SegmentKey Trend
Passenger CarsShare erosion as retail dispensing capacity contracts in North America
Light Commercial VehiclesUrban zero-emission zones pulling forward last-mile fleet orders
BusesTender-driven volumes concentrated in Chinese and Korean municipalities
Trucks (Medium & Heavy-Duty)Payload advantage over battery platforms anchoring long-haul adoption
Others (Material Handling)Warehouse duty cycles delivering the clearest near-term payback


Commercial platforms are overtaking retail as the demand engine. Fleet buyers evaluate cost per tonne-kilometre rather than sticker price, which favours hydrogen wherever utilization is high, and downtime is expensive.

By Technology

Sub-SegmentKey Trend
Proton Exchange Membrane Fuel CellCatalyst loading reductions cutting platinum intensity per kilowatt
Phosphoric Acid Fuel CellConfined to legacy transit and stationary retrofit installations
Solid Oxide Fuel CellGaining traction in range-extender and auxiliary power roles
Alkaline Fuel CellNon-precious catalyst research targeting lower system cost
OthersEarly-stage chemistries with limited commercial deployment


Membrane architecture will retain overwhelming share through 2035. Competition is shifting from chemistry selection to manufacturing yield, membrane thinning, and bipolar plate cost.

By Driving Range

Sub-SegmentKey Trend
Less Than or Equal To 250 MilesOptimized for fixed urban routes returning to depot nightly
251–500 MilesSweet spot for regional distribution and intercity coaches
Above 500 MilesLiquid hydrogen storage unlocking true long-haul parity


Range requirements track directly to duty cycle rather than buyer preference. Corridors with dense dispensing tolerate shorter range; sparse geographies push buyers toward the upper tier.

By Power Output

Sub-SegmentKey Trend
Less Than 100 kWStandard for passenger and light commercial applications
100–200 kWModular twin-stack designs serving buses and medium trucks
Above 200 kWMulti-stack integration for Class 8 and off-highway equipment


Higher output tiers grow fastest because they align with the heavy applications where hydrogen competes most credibly. Modularity is the enabling design choice, letting suppliers serve multiple tiers from one production line.

By End-Use Ownership

Sub-SegmentKey Trend
Private / PersonalDependent on retail station availability and purchase incentives
Commercial FleetFastest expansion as total cost of ownership approaches diesel parity
Public Transport / GovernmentStable, tender-funded baseline demand insulated from fuel price swings


By Region

Sub-SegmentKey Trend
North AmericaPivot from light-duty retail toward drayage and hub-linked freight
EuropeRegulation-led corridor buildout creating mandated refuelling coverage
Asia-PacificVertically integrated manufacturing driving global cost benchmarks
South AmericaExport-oriented electrolysis projects seeding domestic mobility offtake
Middle East & AfricaSolar hydrogen complexes using fleets as anchor demand


Regional leadership depends on whether policy addresses fuel supply or only vehicle purchase. Regions subsidizing both sides of the equation are converting pilots into fleets; those subsidizing vehicles alone are not.




Download PDF ×

We do not share your information with anyone. However, we may send you emails based on your report interest from time to time. You may contact us at any time to opt-out.