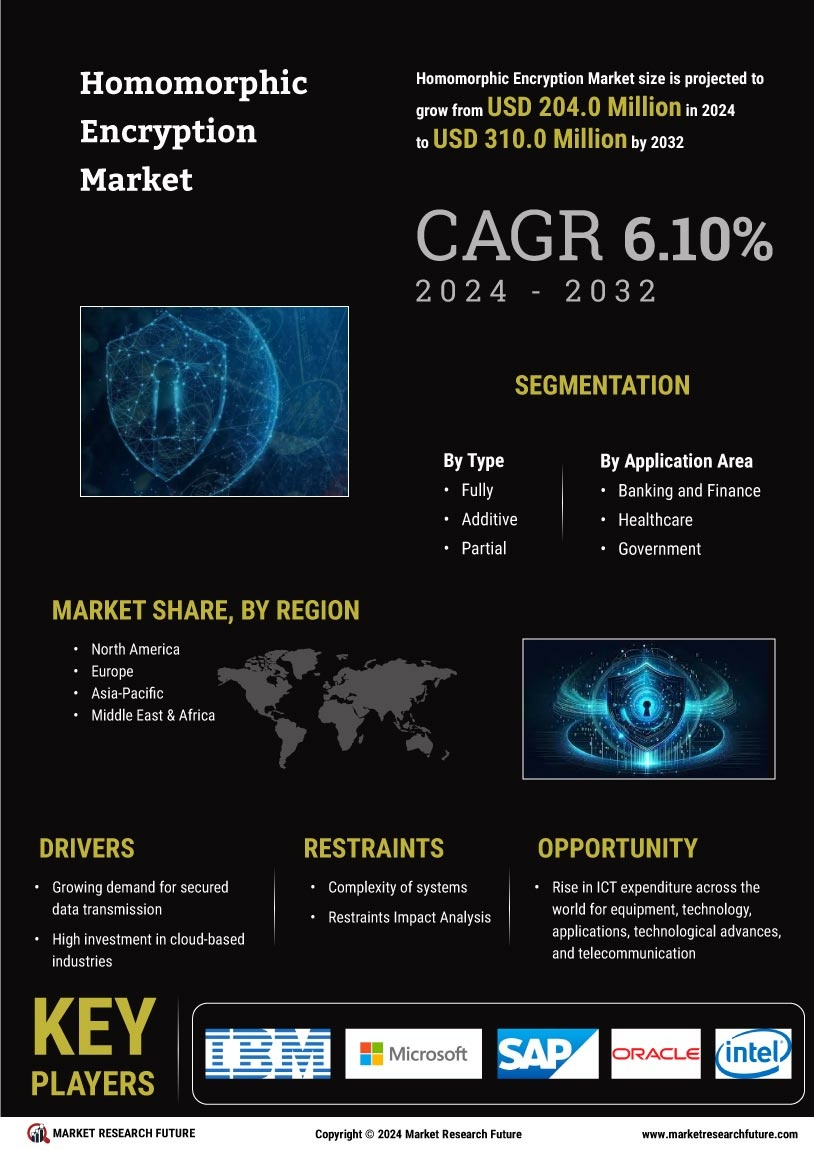
Certified Global Research Member
Isomar fd.webp Wcrc 57.webp
Key Questions Answered
  • Global Market Outlook
  • In-depth analysis of global and regional trends
  • Analyze and identify the major players in the market, their market share, key developments, etc.
  • To understand the capability of the major players based on products offered, financials, and strategies.
  • Identify disrupting products, companies, and trends.
  • To identify opportunities in the market.
  • Analyze the key challenges in the market.
  • Analyze the regional penetration of players, products, and services in the market.
  • Comparison of major players’ financial performance.
  • Evaluate strategies adopted by major players.
  • Recommendations
Why Choose Market Research Future?
  • Vigorous research methodologies for specific market.
  • Knowledge partners across the globe
  • Large network of partner consultants.
  • Ever-increasing/ Escalating data base with quarterly monitoring of various markets
  • Trusted by fortune 500 companies/startups/ universities/organizations
  • Large database of 5000+ markets reports.
  • Effective and prompt pre- and post-sales support.

Homomorphic Encryption Market Research Report Information By Type (Fully, Additive, Partial and Multiplicative), By Application (Banking and Finance, Healthcare, Government, Industrial and others), By Region (North America, Europe, Asia-Pacific, Middle East & Africa, and South America) - Forecast till 2032.


ID: MRFR/ICT/0638-CR | 140 Pages | Author: Aarti Dhapte| March 2023

Homomorphic Encryption Market Segmentation


Global Homomorphic Encryption, By Type Outlook (USD Million, 2018-2030)


  • Fully


  • Additive


  • Partial


  • Multiplicative


Global Homomorphic Encryption, By Application Area Outlook (USD Million, 2018-2030)


  • Banking and Finance


  • Healthcare


  • Government


  • Industrial


  • Others


Global Homomorphic Encryption Regional Outlook (USD Million, 2018-2030)


  • North America Outlook (USD Million, 2018-2030)


    • North America Homomorphic Encryption, By Type Outlook (USD Million, 2018-2030)

      • Fully

      • Additive

      • Partial

      • Multiplicative


    • North America Homomorphic Encryption, By Application Area (USD Million, 2018-2030)

      • Banking and Finance

      • Healthcare

      • Government

      • Industrial

      • Others


    • US Outlook (USD Million, 2018-2030)


    • US Homomorphic Encryption, By Type Outlook (USD Million, 2018-2030)

      • Fully

      • Additive

      • Partial

      • Multiplicative


    • US Homomorphic Encryption, By Application Area (USD Million, 2018-2030)

      • Banking and Finance

      • Healthcare

      • Government

      • Industrial

      • Others


    • Canada Outlook (USD Million, 2018-2030)


    • Canada Homomorphic Encryption, By Type Outlook (USD Million, 2018-2030)

      • Fully

      • Additive

      • Partial

      • Multiplicative


    • Canada Homomorphic Encryption, By Application Area (USD Million, 2018-2030)

      • Banking and Finance

      • Healthcare

      • Government

      • Industrial

      • Others


    • Mexico Outlook (USD Million, 2018-2030)


    • Mexico Homomorphic Encryption, By Type Outlook (USD Million, 2018-2030)

      • Fully

      • Additive

      • Partial

      • Multiplicative


    • Mexico Homomorphic Encryption, By Application Area (USD Million, 2018-2030)

      • Banking and Finance

      • Healthcare

      • Government

      • Industrial

      • Others


  • Europe Outlook (USD Million, 2018-2030)


    • Europe Homomorphic Encryption, By Type Outlook (USD Million, 2018-2030)

      • Fully

      • Additive

      • Partial

      • Multiplicative


    • Europe Homomorphic Encryption, By Application Area (USD Million, 2018-2030)

      • Banking and Finance

      • Healthcare

      • Government

      • Industrial

      • Others


    • Germany Outlook (USD Million, 2018-2030)


    • Germany Homomorphic Encryption, By Type Outlook (USD Million, 2018-2030)

      • Fully

      • Additive

      • Partial

      • Multiplicative


    • Germany Homomorphic Encryption, By Application Area (USD Million, 2018-2030)

      • Banking and Finance

      • Healthcare

      • Government

      • Industrial

      • Others


    • France Outlook (USD Million, 2018-2030)


    • France Homomorphic Encryption, By Type Outlook (USD Million, 2018-2030)

      • Fully

      • Additive

      • Partial

      • Multiplicative


    • France Homomorphic Encryption, By Application Area (USD Million, 2018-2030)

      • Banking and Finance

      • Healthcare

      • Government

      • Industrial

      • Others


    • UK Outlook (USD Million, 2018-2030)


    • UK Homomorphic Encryption, By Type Outlook (USD Million, 2018-2030)

      • Fully

      • Additive

      • Partial

      • Multiplicative


    • UK Homomorphic Encryption, By Application Area (USD Million, 2018-2030)

      • Banking and Finance

      • Healthcare

      • Government

      • Industrial

      • Others


    • Rest of Europe Outlook (USD Million, 2018-2030)


    • Rest of Europe Homomorphic Encryption, By Type Outlook (USD Million, 2018-2030)

      • Fully

      • Additive

      • Partial

      • Multiplicative


    • Rest of Europe Homomorphic Encryption, By Application Area (USD Million, 2018-2030)

      • Banking and Finance

      • Healthcare

      • Government

      • Industrial

      • Others


  • Asia-Pacific Outlook (USD Million, 2018-2030)


    • Asia-Pacific Homomorphic Encryption, By Type Outlook (USD Million, 2018-2030)

      • Fully

      • Additive

      • Partial

      • Multiplicative


    • Asia-Pacific Homomorphic Encryption, By Application Area (USD Million, 2018-2030)

      • Banking and Finance

      • Healthcare

      • Government

      • Industrial

      • Others


    • China Outlook (USD Million, 2018-2030)


    • China Homomorphic Encryption, By Type Outlook (USD Million, 2018-2030)

      • Fully

      • Additive

      • Partial

      • Multiplicative


    • China Homomorphic Encryption, By Application Area (USD Million, 2018-2030)

      • Banking and Finance

      • Healthcare

      • Government

      • Industrial

      • Others


    • India Outlook (USD Million, 2018-2030)


    • India Homomorphic Encryption, By Type Outlook (USD Million, 2018-2030)

      • Fully

      • Additive

      • Partial

      • Multiplicative


    • India Homomorphic Encryption, By Application Area (USD Million, 2018-2030)

      • Banking and Finance

      • Healthcare

      • Government

      • Industrial

      • Others


    • Japan Outlook (USD Million, 2018-2030)


    • Japan Homomorphic Encryption, By Type Outlook (USD Million, 2018-2030)

      • Fully

      • Additive

      • Partial

      • Multiplicative


    • Japan Homomorphic Encryption, By Application Area (USD Million, 2018-2030)

      • Banking and Finance

      • Healthcare

      • Government

      • Industrial

      • Others


    • Rest of Asia-Pacific Outlook (USD Million, 2018-2030)


    • Rest of Asia-Pacific Homomorphic Encryption, By Type Outlook (USD Million, 2018-2030)

      • Fully

      • Additive

      • Partial

      • Multiplicative


    • Rest of Asia-Pacific Homomorphic Encryption, By Application Area (USD Million, 2018-2030)

      • Banking and Finance

      • Healthcare

      • Government

      • Industrial

      • Others


  • Rest of the World Outlook (USD Million, 2018-2030)


    • Rest of the World Homomorphic Encryption, By Type Outlook (USD Million, 2018-2030)

      • Fully

      • Additive

      • Partial

      • Multiplicative


    • Rest of the World Homomorphic Encryption, By Application Area (USD Million, 2018-2030)

      • Banking and Finance

      • Healthcare

      • Government

      • Industrial

      • Others


    • Middle East & Africa Outlook (USD Million, 2018-2030)

    • Middle East & Africa Homomorphic Encryption, By Type Outlook (USD Million, 2018-2030)


      • Fully

      • Additive

      • Partial

      • Multiplicative


    • Middle East & Africa Homomorphic Encryption, By Application Area (USD Million, 2018-2030)

      • Banking and Finance

      • Healthcare

      • Government

      • Industrial

      • Others


    • South America Outlook (USD Million, 2018-2030)


    • South America Homomorphic Encryption, By Type Outlook (USD Million, 2018-2030)

      • Fully

      • Additive

      • Partial

      • Multiplicative


    • South America Homomorphic Encryption, By Application Area (USD Million, 2018-2030)

      • Banking and Finance

      • Healthcare

      • Government

      • Industrial

      • Others


Research Methodology on Homomorphic Encryption Market


Introduction


This research report aims at providing an in-depth analysis of the homomorphic encryption market and the key stakeholders involved in global market for homomorphic encryption market. The published research report by Market Research Future focuses on understanding the current market and its future prospects. The said research report provides insights into the trends within the homomorphic encryption market, the competitive landscape, market size and forecast, restraints, drivers, and opportunities available in the market. It also provides an overall assessment of the market’s growth potential over the forecast period 2023 to 2030.


Research Methodology


To comprehend the information and data related to the homomorphic encryption market, MRFR has adopted an extensive research approach. The research methodology used here involves an extensive secondary data review and qualified primary research through interviews, questionnaires, and surveys. The primary research is conducted with the help of market leaders having a thorough knowledge of their domain of expertise. 


The secondary research is done by analyzing various sources such as company-related reports and documents, industry-related white papers, research studies, company presentations and annual reports, industry associations and regulatory authority reports, media-generated content, government-issued documents and others. Moreover, MRFR has conducted an exhaustive primary research using both online and offline surveys, focus groups, interviews and other data collection methods to understand and validate our market estimates and forecasts. 


Scope of the Study


The scope of this research report includes analyzing the current market trends, analysis and predicting the future potential of the homomorphic encryption market by segmenting the market into different sub-segments. The said research report allows readers to gain an understanding of the global market from an overarching perspective, backed by accurate data and forecasts.


Research Objectives


The primary objectives of our research report are:


  • To offer detailed information and insights into the global homomorphic encryption Market, including market segmentation, current and forecast scenarios

  • To provide detailed information and insights into market dynamics, such as drivers, restraints, and opportunities, such as the growing demand for secured data transmission

  • To offer an in-depth analysis of the competitive landscape in the encryption market.

  • To provide a detailed assessment of porter's five forces on the global homomorphic encryption market


Research Approach


The approach followed by MRFR is to determine the future potential of the homomorphic encryption market, and employs both quantitative and qualitative techniques. The top-down and bottom-up approaches are used for data collection and market estimation.


The quantitative research focuses on collecting data related to the said market such as market size, trends, and forecast from a global perspective. This data is based on primary and secondary research. The primary research includes interviews with industry experts, market players and opinion leaders. This data is then used to validate the assumptions and validate market forecasts. The data collected through primary and secondary sources is processed and analyzed with the help of various statistical and analytical tools, such as excel, and other software.


The qualitative portion of the research provides an in-depth understanding of the market dynamics. To this end, market experts and consults are interviewed to gain insights into the driving and restraining forces, market trends, competitive scenarios, and opportunities in the homomorphic encryption market. Key players in the market are also interviewed to gain a better understanding of the competitive dynamics and competitive impact on the market.


Data Collection and Analysis


MRFR collects data from reliable and trusted sources, such as primary and secondary sources, including research studies, company documents, and databases. It also contacts industry experts for further data input. Data is collected from both primary and secondary sources and the methods used for the data collection include interviews, surveys, and focus groups.


The data collected is then analyzed to evaluate the global homomorphic encryption market. After the data collection is complete, it is subjected to extensive data analysis. MRFR uses advanced quantitative and qualitative data analysis tools such as Excel, and other software to analyze collected data.


The results of the analysis are used to draw meaningful conclusions and make accurate market projections. This data is also used to develop our market-forecast models.


Conclusion


The research methodology by MRFR aims at providing an in-depth analysis of the global homomorphic encryption market. The said research methodology is based on a combination of quantitative and qualitative techniques to offer a well-rounded assessment of the market. The said research methodology focuses on data collected from reliable sources and then subjecting it to an extensive data analysis process.

Leading companies partner with us for data-driven Insights
client_1 client_2 client_3 client_4 client_5 client_6 client_7 client_8 client_9 client_10
Please fill in Business Email for Quick Response

TABLE OF CONTENTS

1. EXECUTIVE SUMMARY

1.1. Market Attractiveness Analysis

1.1.1. Global Homomorphic Encryption Market, by Type

1.1.2. Global Homomorphic Encryption Market, by Application Area

1.1.3. Global Homomorphic Encryption Market, by Region

2. MARKET INTRODUCTION

2.1. Definition

2.2. Scope of the Study

2.3. Market Structure

2.4. Key Buying Criteria

2.5. Macro Factor Indicator Analysis

3. RESEARCH METHODOLOGY

3.1. Research Process

3.2. Primary Research

3.3. Secondary Research

3.4. Market Size Estimation

3.5. Forecast Model

3.6. List of Assumptions

4. MARKET DYNAMICS

4.1. Introduction

4.2. Drivers

4.2.1. Growing demand for secured data transmission

4.2.2. High investment in cloud-based industries

4.2.3. Drivers Impact Analysis

4.3. Restraints

4.3.1. Complexity of systems

4.3.2. Restraints Impact Analysis

4.4. Opportunities

4.4.1. Rise in ICT expenditure across the world for equipment, technology, applications, technological advances, and telecommunication

4.5. Impact of COVID-19

4.5.1. Impact On Homomorphic Encryption Market

4.5.2. Impact On End User Verticals

4.5.3. Covid-19 Impact On Value Chain

5. MARKET FACTOR ANALYSIS

5.1. Value Chain Analysis/Supply Chain Analysis

5.2. Porter’s Five Forces Model

5.3. Bargaining Power of Suppliers

5.4. Bargaining Power of Buyers

5.5. Threat of New Entrants

5.6. Threat of Substitutes

5.7. Intensity of Rivalry

6. GLOBAL HOMOMORPHIC ENCRYPTION MARKET, BY TYPE

6.1. Introduction

6.2. Fully

6.3. Additive

6.4. Partial

6.5. Multiplicative

7. GLOBAL HOMOMORPHIC ENCRYPTION MARKET, BY APPLICATION AREA

7.1. Introduction

7.2. Banking and Finance

7.3. Healthcare

7.4. Government

7.5. Industrial

7.6. Others

8. GLOBAL HOMOMORPHIC ENCRYPTION MARKET SIZE ESTIMATION & FORECAST, BY REGION

8.1. Introduction

8.2. North America

8.2.1. Market Estimates & Forecast, by Country, 2018-2030

8.2.2. Market Estimates & Forecast, by Type, 2018-2030

8.2.3. Market Estimates & Forecast, by Application Area, 2018-2030

8.2.4. US

8.2.5. Market Estimates & Forecast, by Type, 2018-2030

8.2.6. Market Estimates & Forecast, by Application Area, 2018-2030

8.2.7. Canada

8.2.1. Market Estimates & Forecast, by Type, 2018-2030

8.2.2. Market Estimates & Forecast, by Application Area, 2018-2030

8.2.3. Mexico

8.2.1. Market Estimates & Forecast, by Type, 2018-2030

8.2.2. Market Estimates & Forecast, by Application Area, 2018-2030

8.3. Europe

8.3.1. Market Estimates & Forecast, by Country, 2018-2030

8.3.1. Market Estimates & Forecast, by Type, 2018-2030

8.3.2. Market Estimates & Forecast, by Application Area, 2018-2030

8.3.3. UK

8.3.1. Market Estimates & Forecast, by Type, 2018-2030

8.3.2. Market Estimates & Forecast, by Application Area, 2018-2030

8.3.3. Germany

8.3.1. Market Estimates & Forecast, by Type, 2018-2030

8.3.2. Market Estimates & Forecast, by Application Area, 2018-2030

8.3.3. France

8.3.1. Market Estimates & Forecast, by Type, 2018-2030

8.3.2. Market Estimates & Forecast, by Application Area, 2018-2030

8.3.3. Rest of Europe

8.3.1. Market Estimates & Forecast, by Type, 2018-2030

8.3.2. Market Estimates & Forecast, by Application Area, 2018-2030

8.4. Asia-Pacific

8.4.1. Market Estimates & Forecast, by Country, 2018-2030

8.4.2. Market Estimates & Forecast, by Type, 2018-2030

8.4.3. Market Estimates & Forecast, by Application Area, 2018-2030

8.4.4. China

8.4.1. Market Estimates & Forecast, by Type, 2018-2030

8.4.2. Market Estimates & Forecast, by Application Area, 2018-2030

8.4.3. Japan

8.4.1. Market Estimates & Forecast, by Type, 2018-2030

8.4.2. Market Estimates & Forecast, by Application Area, 2018-2030

8.4.3. India

8.4.1. Market Estimates & Forecast, by Type, 2018-2030

8.4.2. Market Estimates & Forecast, by Application Area, 2018-2030

8.4.3. Rest of Asia-Pacific

8.4.4. Market Estimates & Forecast, by Type, 2018-2030

8.4.5. Market Estimates & Forecast, by Application Area, 2018-2030

8.5. Middle East & Africa

8.5.1. Market Estimates & Forecast, by Type, 2018-2030

8.5.2. Market Estimates & Forecast, by Application Area, 2018-2030

8.6. South America

8.6.1. Market Estimates & Forecast, by Type, 2018-2030

8.6.2. Market Estimates & Forecast, by Application Area, 2018-2030

9. COMPETITIVE LANDSCAPE

9.1. Introduction

9.2. Key Developments & Growth Strategies

9.3. Competitor Benchmarking

9.4. Vendor Share Analysis, 2021(% Share)

10. COMPANY PROFILES

10.1. IBM

10.1.1. Company Overview

10.1.2. Financial Overview

10.1.3. Solution/Services Offered

10.1.4. Key Developments

10.1.5. SWOT Analysis

10.1.6. Key Strategies

10.2. MICROSOFT

10.3. SAP

10.4. Oracle

10.5. Intel

10.6. Google LLC

10.7. Cosmian Tech

10.8. CryptoExperts SAS

10.9. Duality Technologies Inc.

10.10. Enveil Inc.

10.11. Inpher, Inc.

10.12. Netskope, Inc.

10.13. Thales Group

10.14. Zaiku Group Ltd.

NOTE:

This table of content is tentative and subject to change as the research progresses.

ï‚¡ In section 12, only the top 10 companies will be profiled. Each company will be profiled based on the Market Overview, Financials, Service Portfolio, Business Strategies, and Recent Developments parameters.

 The companies are selected based on two broad criteria¬– strength of product portfolio and excellence in business strategies.

 Key parameters considered for evaluating strength of the vendor’s product portfolio are industry experience, product capabilities/features, innovations/R&D investment, flexibility to customize the product, ability to integrate with other systems, pre- and post-sale services, and customer ratings/feedback.

 Key parameters considered for evaluating a vendor’s excellence in business strategy are its market share, global presence, customer base, partner ecosystem (Provider alliances/resellers/distributors), acquisitions, and marketing strategies/investments.

The financial details of the company cannot be provided if the information is not available in the public domain and or from reliable sources.  

LIST OF TABLES

TABLE 1 MARKET SYNOPSIS 19

TABLE 2 GLOBAL HOMOMORPHIC ENCRYPTION MARKET, BY TYPE, 2018–2030 (USD MILLION) 49

TABLE 3 GLOBAL HOMOMORPHIC ENCRYPTION MARKET, BY APPLICATION AREA, 2018–2030 (USD MILLION) 52

TABLE 4 GLOBAL HOMOMORPHIC ENCRYPTION MARKET, BY REGION, 2018–2030 (USD MILLION) 55

TABLE 5 NORTH AMERICA HOMOMORPHIC ENCRYPTION MARKET, BY COUNTRY, 2018–2030 (USD MILLION) 57

TABLE 6 NORTH AMERICA HOMOMORPHIC ENCRYPTION MARKET, BY TYPE, 2018–2030 (USD MILLION) 57

TABLE 7 NORTH AMERICA HOMOMORPHIC ENCRYPTION MARKET, BY APPLICATION AREA, 2018–2030 (USD MILLION) 61

TABLE 8 US HOMOMORPHIC ENCRYPTION MARKET, BY TYPE, 2018–2030 (USD MILLION) 63

TABLE 9 US HOMOMORPHIC ENCRYPTION MARKET, BY APPLICATION AREA, 2018–2030 (USD MILLION) 63

TABLE 10 CANADA HOMOMORPHIC ENCRYPTION MARKET, BY TYPE, 2018–2030 (USD MILLION) 64

TABLE 11 CANADA HOMOMORPHIC ENCRYPTION MARKET, BY APPLICATION AREA, 2018–2030 (USD MILLION) 65

TABLE 12 MEXICO HOMOMORPHIC ENCRYPTION MARKET, BY TYPE, 2018–2030 (USD MILLION) 66

TABLE 13 MEXICO HOMOMORPHIC ENCRYPTION MARKET, BY APPLICATION AREA, 2018–2030 (USD MILLION) 66

TABLE 14 EUROPE HOMOMORPHIC ENCRYPTION MARKET, BY COUNTRY, 2018–2030 (USD MILLION) 67

TABLE 15 EUROPE HOMOMORPHIC ENCRYPTION MARKET, BY TYPE, 2018–2030 (USD MILLION) 68

TABLE 16 EUROPE HOMOMORPHIC ENCRYPTION MARKET, BY APPLICATION AREA, 2018–2030 (USD MILLION) 68

TABLE 17 UK HOMOMORPHIC ENCRYPTION MARKET, BY TYPE, 2018–2030 (USD MILLION) 68

TABLE 18 UK HOMOMORPHIC ENCRYPTION MARKET, BY APPLICATION AREA, 2018–2030 (USD MILLION) 68

TABLE 19 GERMANY HOMOMORPHIC ENCRYPTION MARKET, BY TYPE, 2018–2030 (USD MILLION) 70

TABLE 20 GERMANY HOMOMORPHIC ENCRYPTION MARKET, BY APPLICATION AREA, 2018–2030 (USD MILLION) 70

TABLE 21 FRANCE HOMOMORPHIC ENCRYPTION MARKET, BY TYPE, 2018–2030 (USD MILLION) 71

TABLE 22 FRANCE HOMOMORPHIC ENCRYPTION MARKET, BY APPLICATION AREA, 2018–2030 (USD MILLION) 71

TABLE 23 SPAIN HOMOMORPHIC ENCRYPTION MARKET, BY TYPE, 2018–2030 (USD MILLION) 71

TABLE 24 SPAIN HOMOMORPHIC ENCRYPTION MARKET, BY APPLICATION AREA, 2018–2030 (USD MILLION) 73

TABLE 25 ITALY HOMOMORPHIC ENCRYPTION MARKET, BY TYPE, 2018–2030 (USD MILLION) 73

TABLE 26 ITALY HOMOMORPHIC ENCRYPTION MARKET, BY APPLICATION AREA, 2018–2030 (USD MILLION) 74

TABLE 27 REST OF EUROPE HOMOMORPHIC ENCRYPTION MARKET, BY TYPE, 2018–2030 (USD MILLION) 74

TABLE 28 REST OF EUROPE HOMOMORPHIC ENCRYPTION MARKET, BY APPLICATION AREA, 2018–2030 (USD MILLION) 74

TABLE 29 ASIA-PACIFIC HOMOMORPHIC ENCRYPTION MARKET, BY COUNTRY, 2018–2030 (USD MILLION) 77

TABLE 30 ASIA-PACIFIC HOMOMORPHIC ENCRYPTION MARKET, BY TYPE, 2018–2030 (USD MILLION) 78

TABLE 31 ASIA-PACIFIC HOMOMORPHIC ENCRYPTION MARKET, BY APPLICATION AREA, 2018–2030 (USD MILLION) 78

TABLE 32 CHINA HOMOMORPHIC ENCRYPTION MARKET, BY TYPE, 2018–2030 (USD MILLION) 79

TABLE 33 CHINA HOMOMORPHIC ENCRYPTION MARKET, BY APPLICATION AREA, 2018–2030 (USD MILLION) 80

TABLE 34 JAPAN HOMOMORPHIC ENCRYPTION MARKET, BY TYPE, 2018–2030 (USD MILLION) 80

TABLE 35 JAPAN HOMOMORPHIC ENCRYPTION MARKET, BY APPLICATION AREA, 2018–2030 (USD MILLION) 81

TABLE 36 INDIA HOMOMORPHIC ENCRYPTION MARKET, BY TYPE, 2018–2030 (USD MILLION) 81

TABLE 37 INDIA HOMOMORPHIC ENCRYPTION MARKET, BY APPLICATION AREA, 2018–2030 (USD MILLION) 82

TABLE 38 SOUTH KOREA HOMOMORPHIC ENCRYPTION MARKET, BY TYPE, 2018–2030 (USD MILLION) 82

TABLE 39 SOUTH KOREA HOMOMORPHIC ENCRYPTION MARKET, BY APPLICATION AREA, 2018–2030 (USD MILLION) 82

TABLE 40 REST OF ASIA-PACIFIC HOMOMORPHIC ENCRYPTION MARKET, BY TYPE, 2018–2030 (USD MILLION) 84

TABLE 41 REST OF ASIA-PACIFIC HOMOMORPHIC ENCRYPTION MARKET, BY APPLICATION AREA, 2018–2030 (USD MILLION) 85

TABLE 42 SOUTH AMERICA HOMOMORPHIC ENCRYPTION MARKET, BY TYPE, 2018–2030 (USD MILLION) 85

TABLE 43 SOUTH AMERICA HOMOMORPHIC ENCRYPTION MARKET, BY APPLICATION AREA, 2018–2030 (USD MILLION) 85

TABLE 44 MIDDLE EAST & AFRICA HOMOMORPHIC ENCRYPTION MARKET, BY TYPE, 2018–2030 (USD MILLION) 85

TABLE 45 MIDDLE EAST & AFRICA HOMOMORPHIC ENCRYPTION MARKET, BY APPLICATION AREA, 2018–2030 (USD MILLION) 87

TABLE 46 BUSINESS EXPANSIONS/PRODUCT LAUNCHES 87

TABLE 47 PARTNERSHIPS/AGREEMENTS/CONTRACTS/COLLABORATIONS 88

TABLE 48 ACQUISITIONS/MERGERS 88

TABLE 49 IBM : PRODUCTS OFFERED 88

TABLE 50 IBM : KEY DEVELOPMENT 90

TABLE 51 MICROSOFT : PRODUCTS OFFERED 90

TABLE 52 MICROSOFT : KEY DEVELOPMENT 90

TABLE 53 NIKON : PRODUCTS OFFERED 91

TABLE 54 NIKON : KEY DEVELOPMENT 91

TABLE 55 SAP : PRODUCTS OFFERED 92

TABLE 56 SAP : KEY DEVELOPMENT 92

TABLE 57 ORACLE : PRODUCTS OFFERED 93

TABLE 58 ORACLE : KEY DEVELOPMENT 93

TABLE 59 INTEL : PRODUCTS OFFERED 93

TABLE 60 INTEL : KEY DEVELOPMENT 95

TABLE 61 GOOGLE LLC : PRODUCTS OFFERED 95

TABLE 62 GOOGLE LLC : KEY DEVELOPMENT 96

TABLE 63 INPHER INC. : PRODUCTS OFFERED 96

TABLE 64 INPHER INC. : KEY DEVELOPMENT 96

TABLE 65 THALES GROUP : PRODUCTS OFFERED 99

TABLE 66 THALES GROUP : KEY DEVELOPMENT 99

LIST OF FIGURES

FIGURE 1 MARKET ATTRACTIVENESS ANALYSIS: GLOBAL HOMOMORPHIC ENCRYPTION MARKET 20

FIGURE 2 GLOBAL HOMOMORPHIC ENCRYPTION MARKET: MARKET STRUCTURE 22

FIGURE 3 BOTTOM-UP AND TOP-DOWN APPROACHES 27

FIGURE 4 NORTH AMERICA: HOMOMORPHIC ENCRYPTION MARKET SIZE (USD MILLION) & MARKET SHARE (%), BY COUNTRY (2021 VS 2030) 30

FIGURE 5 EUROPE: HOMOMORPHIC ENCRYPTION MARKET SIZE (USD MILLION) & MARKET SHARE (%), BY COUNTRY (2021 VS 2030) 30

FIGURE 6 ASIA–PACIFIC: HOMOMORPHIC ENCRYPTION MARKET SIZE (USD MILLION) & MARKET SHARE (%), BY COUNTRY (2021 VS 2030) 31

FIGURE 7 GLOBAL HOMOMORPHIC ENCRYPTION MARKET SIZE (USD MILLION) & MARKET SHARE (%), BY TYPE (2021 VS 2030) 32

FIGURE 8 GLOBAL HOMOMORPHIC ENCRYPTION MARKET SIZE (USD MILLION) & MARKET SHARE (%), BY APPLICATION AREA (2021 VS 2030) 32

FIGURE 9 MARKET DYNAMIC ANALYSIS OF THE GLOBAL HOMOMORPHIC ENCRYPTION MARKET 33

FIGURE 10 DRIVER IMPACT ANALYSIS 34

FIGURE 11 RESTRAINT IMPACT ANALYSIS 34

FIGURE 12 VALUE CHAIN: GLOBAL HOMOMORPHIC ENCRYPTION MARKET 35

FIGURE 13 PORTER'S FIVE FORCES ANALYSIS OF THE GLOBAL HOMOMORPHIC ENCRYPTION MARKET 37

FIGURE 14 GLOBAL HOMOMORPHIC ENCRYPTION MARKET, BY TYPE, 2021 (% SHARE) 37

FIGURE 15 GLOBAL HOMOMORPHIC ENCRYPTION MARKET, BY TYPE, 2021 VS 2030 (USD MILLION) 43

FIGURE 16 GLOBAL HOMOMORPHIC ENCRYPTION MARKET, BY APPLICATION AREA, 2021 (% SHARE) 45

FIGURE 17 GLOBAL HOMOMORPHIC ENCRYPTION MARKET, BY APPLICATION AREA, 2021 VS 2030 (USD MILLION) 48

FIGURE 18 GLOBAL HOMOMORPHIC ENCRYPTION MARKET, BY REGION, 2021 (% SHARE) 48

FIGURE 19 GLOBAL HOMOMORPHIC ENCRYPTION MARKET, BY REGION, 2021 VS 2030 (USD MILLION) 51

FIGURE 20 NORTH AMERICA HOMOMORPHIC ENCRYPTION MARKET, BY COUNTRY, 2021 (% SHARE) 51

FIGURE 21 NORTH AMERICA HOMOMORPHIC ENCRYPTION MARKET, BY COUNTRY, 2021 VS 2030 (USD MILLION) 54

FIGURE 22 NORTH AMERICA HOMOMORPHIC ENCRYPTION MARKET, BY TYPE, 2021-2030 (USD MILLION) 54

FIGURE 23 NORTH AMERICA HOMOMORPHIC ENCRYPTION MARKET, BY APPLICATION AREA, 2021-2030 (USD MILLION) 56

FIGURE 24 EUROPE HOMOMORPHIC ENCRYPTION MARKET, BY COUNTRY, 2021 (% SHARE) 56

FIGURE 25 EUROPE HOMOMORPHIC ENCRYPTION MARKET, BY COUNTRY, 2021 VS 2030 (USD MILLION) 56

FIGURE 26 EUROPE HOMOMORPHIC ENCRYPTION MARKET, BY TYPE, 2021-2030 (USD MILLION) 56

FIGURE 27 EUROPE HOMOMORPHIC ENCRYPTION MARKET, BY APPLICATION AREA, 2021-2030 (USD MILLION) 56

FIGURE 28 ASIA-PACIFIC HOMOMORPHIC ENCRYPTION MARKET, BY COUNTRY, 2021 (% SHARE) 60

FIGURE 29 ASIA-PACIFIC HOMOMORPHIC ENCRYPTION MARKET, BY COUNTRY, 2021 VS 2030 (USD MILLION) 62

FIGURE 30 ASIA-PACIFIC HOMOMORPHIC ENCRYPTION MARKET, BY TYPE, 2021-2030 (USD MILLION) 62

FIGURE 31 ASIA-PACIFIC HOMOMORPHIC ENCRYPTION MARKET, BY APPLICATION AREA, 2021-2030 (USD MILLION) 63

FIGURE 32 SOUTH AMERICA HOMOMORPHIC ENCRYPTION MARKET, BY TYPE, 2021-2030 (USD MILLION) 64

FIGURE 33 SOUTH AMERICA HOMOMORPHIC ENCRYPTION MARKET, BY APPLICATION AREA, 2021-2030 (USD MILLION) 65

FIGURE 34 MIDDLE EAST & AFRICA HOMOMORPHIC ENCRYPTION MARKET, BY TYPE, 2021-2030 (USD MILLION) 65

FIGURE 35 MIDDLE EAST & AFRICA HOMOMORPHIC ENCRYPTION MARKET, BY APPLICATION AREA, 2021-2030 (USD MILLION) 65

FIGURE 36 GLOBAL HOMOMORPHIC ENCRYPTION MARKET: COMPETITIVE BENCHMARKING 65

FIGURE 37 VENDOR SHARE ANALYSIS (2021) (%) 76

FIGURE 38 IBM :FINANCIAL OVERVIEW SNAPSHOT 77

FIGURE 39 IBM :SWOT ANALYSIS 78

FIGURE 40 MICROSOFT :FINANCIAL OVERVIEW SNAPSHOT 79

FIGURE 41 MICROSOFT :SWOT ANALYSIS 80

FIGURE 42 NIKON :FINANCIAL OVERVIEW SNAPSHOT 80

FIGURE 43 NIKON :SWOT ANALYSIS 80

FIGURE 44 SAP :FINANCIAL OVERVIEW SNAPSHOT 98

FIGURE 45 SAP :SWOT ANALYSIS 99

FIGURE 46 ORACLE :FINANCIAL OVERVIEW SNAPSHOT 100

FIGURE 47 ORACLE :SWOT ANALYSIS 101

FIGURE 48 INTEL :FINANCIAL OVERVIEW SNAPSHOT 101

FIGURE 49 INTEL :SWOT ANALYSIS 101

FIGURE 50 GOOGLE LLC :FINANCIAL OVERVIEW SNAPSHOT 101

FIGURE 51 GOOGLE LLC :SWOT ANALYSIS 117

FIGURE 52 INPHER INC. :FINANCIAL OVERVIEW SNAPSHOT 118

FIGURE 53 INPHER INC. :SWOT ANALYSIS 119

FIGURE 54 THALES GROUP :FINANCIAL OVERVIEW SNAPSHOT 119

FIGURE 55 THALES GROUP :SWOT ANALYSIS 119

Purchase Option
Single User $ 4,950
Multiuser License $ 5,950
Enterprise User $ 7,250
Compare Licenses
Tailored for You
  • Dedicated Research on any specifics segment or region.
  • Focused Research on specific players in the market.
  • Custom Report based only on your requirements.
  • Flexibility to add or subtract any chapter in the study.
  • Historic data from 2014 and forecasts outlook till 2040.
  • Flexibility of providing data/insights in formats (PDF, PPT, Excel).
  • Provide cross segmentation in applicable scenario/markets.