Segmentation Quick Reference
| Dimension | Sub-Segments | Dominant Segment | Fastest Growing Segment |
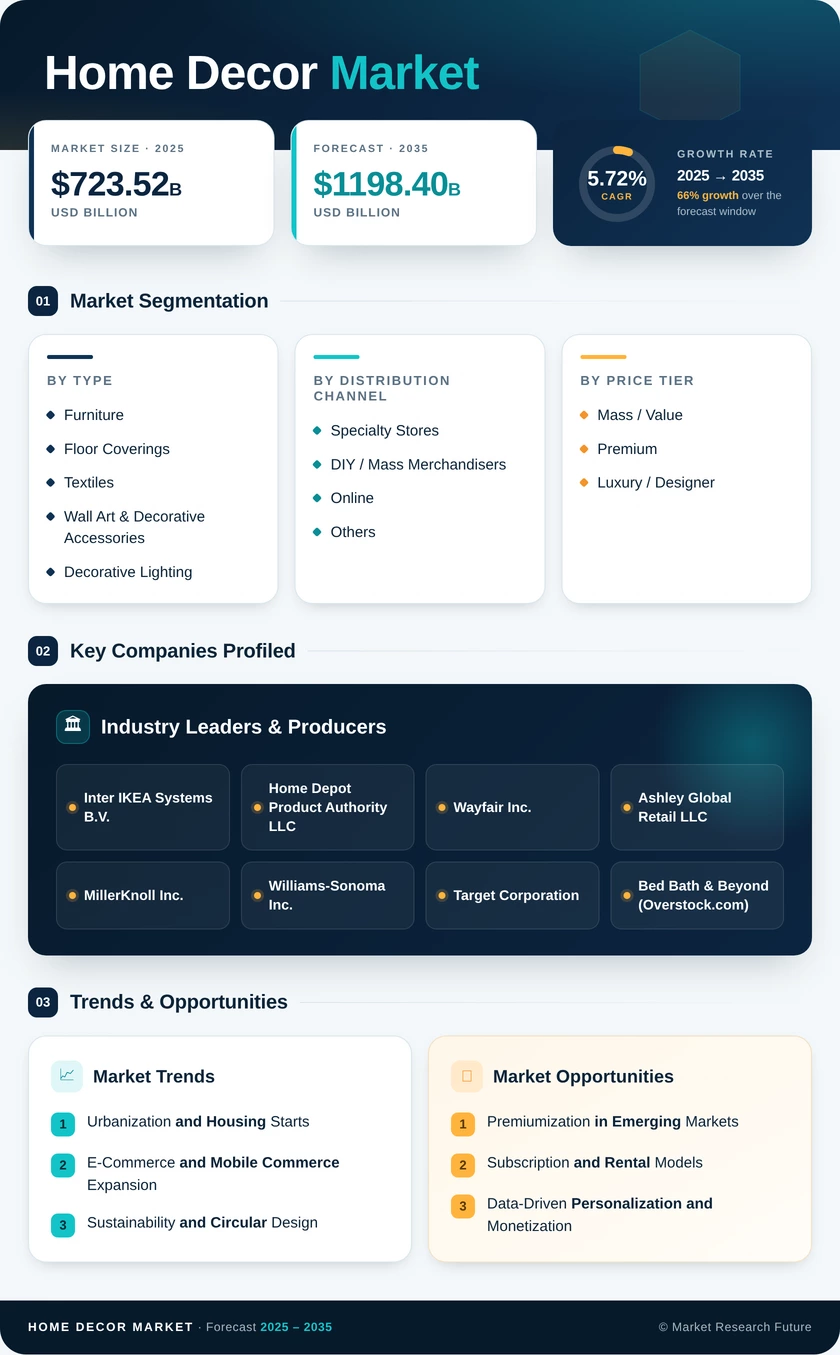
| By Product Category | Furniture, Floor Coverings, Textiles, Wall Art & Decorative Accessories, Decorative Lighting, Others | Floor Coverings (38.27% share, 2025) | Textiles (7.84% CAGR) |
| By Distribution Channel | Specialty Stores, DIY / Mass Merchandisers, Online, Others | Specialty Stores (49.38% share, 2025) | DIY / Mass Merchandisers (8.52% CAGR) |
| By Price Tier | Mass / Value, Premium, Luxury / Designer | Mass / Value (64.62% share, 2025) | Premium (7.48% CAGR) |
| By Region | North America, Europe, Asia-Pacific, South America, Middle East & Africa | North America (44.89% share, 2025) | Asia-Pacific (8.76% CAGR) |
Market Segmentation Overview
By Product Category
| Sub-Segment | Key Trend |
| Furniture | Compact, multi-functional designs for urban micro-apartments |
| Floor Coverings | Luxury vinyl tile is displacing traditional carpet and hardwood |
| Textiles | Fast-refresh seasonal collections driven by social media |
| Wall Art & Decorative Accessories | Personalized and AI-generated custom designs |
| Decorative Lighting | Smart, IoT-enabled ambient and circadian systems |
| Others (Rugs, Mirrors, Candles) | Wellness and aromatherapy integration |
The product category dimension reflects a spectrum from high-ticket durable goods to affordable refresh items. Furniture anchors consumer spending per transaction, while textiles and decorative accessories drive purchase frequency, together shaping the revenue mix across the Home Decor Market.
By Distribution Channel
| Sub-Segment | Key Trend |
| Specialty Stores | Experiential showrooms with AR-assisted visualization |
| DIY / Mass Merchandisers | Private-label décor lines and curated in-store sections |
| Online | Mobile-first commerce with AI personalization engines |
| Others | Pop-up retail and department-store collaborations |
Distribution dynamics in the Home Decor Market are shifting toward omnichannel integration, where specialty retailers invest in digital storefronts and e-commerce players experiment with physical pop-ups to capture consumers across discovery and purchase touchpoints.
By Price Tier
| Sub-Segment | Key Trend |
| Mass / Value | IKEA-led price leadership and volume-driven retail |
| Premium | Brand storytelling and sustainably sourced differentiation |
| Luxury / Designer | Bespoke offerings and high-net-worth clientele exclusivity |
Price-tier dynamics reveal that while mass-market products dominate volume, the premium and luxury segments drive disproportionate margin contribution within the Home Decor Market. These rewarding brands invest in design heritage and sustainability credentials.