Herbicides Market Research Report - Global Forecast till 2027

Global Herbicides Market Research Report: Information by Active Ingredient (Glyphosate, 2, 4-D, Atrazine, Diquat, and Others), Category (Synthetic Herbicides, and Bioherbicides), Mode of Action (Selective and Non-Selective), Crop Type (Pulses & Oilseeds, Cereals & Grains, Fruits & Vegetables, and Others), and Region (North America, Europe, Asia-Pacific, and RoW)– Forecast till 2027

ID: MRFR/AGR/3425-HCR | 110 Pages | Published By Snehal Singh on March 2023         

TABLE OF CONTENTS

1. 1 EXECUTIVE SUMMARY

1.1. Market Attractiveness Analysis

1.1.1. Global Herbicides Market, by Active Ingredient

1.1.2. Global Herbicides Market, by Category

1.1.3. Global Herbicides Market, by Mode of Action

1.1.4. Global Herbicides Market, by Crop Type

1.1.5. Global Herbicides Market, by Region

2. MARKET INTRODUCTION

2.1. Definition

2.2. Scope of the Study

2.3. Market Structure

2.4. Key Buying Criteria

2.5. Macro Factor Indicator Analysis

3. RESEARCH METHODOLOGY

3.1. Research Process

3.2. Primary Research

3.3. Secondary Research

3.4. Market Size Estimation

3.5. Forecast Model

3.6. List of Assumptions

4. MARKET DYNAMICS

4.1. Introduction

4.2. Drivers

4.2.1. Driver 1

4.2.2. Driver 2

4.3. Restraints

4.3.1. Restraint 1

4.3.2. Restraint 2

4.4. Opportunities

4.4.1. Opportunity 1

4.4.2. Opportunity 2

4.5. Challenges

4.5.1. Challenge 1

4.5.2. Challenge 2

5. MARKET FACTOR ANALYSIS

5.1. Value Chain Analysis

5.2. Supply Chain Analysis

5.3. Porter’s Five Forces Model

5.3.1. Bargaining Power of Suppliers

5.3.2. Bargaining Power of Buyers

5.3.3. Threat of New Entrants

5.3.4. Threat of Substitutes

5.3.5. Intensity of Rivalry

6. GLOBAL HERBICIDES MARKET, BY ACTIVE INGREDIENT

6.1. Introduction

6.2. Glyphosate

6.2.1. Glyphosate: Market Estimates & Forecast, by Region/Country, 2020–2027

6.3. 2, 4-D

6.3.1. 2, 4-D: Market Estimates & Forecast, by Region/Country, 2020–2027

6.4. Atrazine

6.4.1. Atrazine: Market Estimates & Forecast, by Region/Country, 2020–2027

6.5. Diquat

6.5.1. Diquat: Market Estimates & Forecast, by Region/Country, 2020–2027

6.6. Others

6.6.1. Others: Market Estimates & Forecast, by Region/Country, 2020–2027

7. GLOBAL HERBICIDES MARKET, BY CATEGORY

7.1. Introduction

7.2. Synthetic Herbicides

7.2.1. Synthetic Herbicides: Market Estimates & Forecast, by Region/Country, 2020–2027

7.3. Bioherbicides

7.3.1. Bioherbicides: Market Estimates & Forecast, by Region/Country, 2020–2027

8. GLOBAL HERBICIDES MARKET, BY MODE OF ACTION

8.1. Introduction

8.2. Selective

8.2.1. Selective: Market Estimates & Forecast, by Region/Country, 2020–2027

8.3. Non-Selective

8.3.1. Non-Selective: Market Estimates & Forecast, by Region/Country, 2020–2027

9. GLOBAL HERBICIDES MARKET, BY CROP TYPE

9.1. Introduction

9.2. Oilseeds & Pulses

9.2.1. Oilseeds & Pulses: Market Estimates & Forecast, by Region/Country, 2020–2027

9.3. Cereals & Grains

9.3.1. Cereals & Grains: Market Estimates & Forecast, by Region/Country, 2020–2027

9.4. Fruits & Vegetables

9.4.1. Fruits & Vegetables: Market Estimates & Forecast, by Region/Country, 2020–2027

9.5. Others

9.5.1. Others: Market Estimates & Forecast, by Region/Country, 2020–2027

10. GLOBAL HERBICIDES MARKET, BY REGION

10.1. Introduction

10.2. North America

10.2.1. Market Estimates & Forecast, by Active Ingredient, 2020–2027

10.2.2. Market Estimates & Forecast, by Category, 2020–2027

10.2.3. Market Estimates & Forecast, by Mode of Action, 2020–2027

10.2.4. Market Estimates & Forecast, by Crop Type, 2020–2027

10.2.5. Market Estimates & Forecast, by Country, 2020–2027

10.2.6. US

10.2.6.1. Market Estimates & Forecast, by Active Ingredient, 2020–2027

10.2.6.2. Market Estimates & Forecast, by Category, 2020–2027

10.2.6.3. Market Estimates & Forecast, by Mode of Action, 2020–2027

10.2.6.4. Market Estimates & Forecast, by Crop Type, 2020–2027

10.2.7. Canada

10.2.7.1. Market Estimates & Forecast, by Active Ingredient, 2020–2027

10.2.7.2. Market Estimates & Forecast, by Category, 2020–2027

10.2.7.3. Market Estimates & Forecast, by Mode of Action, 2020–2027

10.2.7.4. Market Estimates & Forecast, by Crop Type, 2020–2027

10.2.8. Mexico

10.2.8.1. Market Estimates & Forecast, by Active Ingredient, 2020–2027

10.2.8.2. Market Estimates & Forecast, by Category, 2020–2027

10.2.8.3. Market Estimates & Forecast, by Mode of Action, 2020–2027

10.2.8.4. Market Estimates & Forecast, by Crop Type, 2020–2027

10.3. Europe

10.3.1. Market Estimates & Forecast, by Active Ingredient, 2020–2027

10.3.2. Market Estimates & Forecast, by Category, 2020–2027

10.3.3. Market Estimates & Forecast, by Mode of Action, 2020–2027

10.3.4. Market Estimates & Forecast, by Crop Type, 2020–2027

10.3.5. Market Estimates & Forecast, by Country, 2020–2027

10.3.6. Germany

10.3.6.1. Market Estimates & Forecast, by Active Ingredient, 2020–2027

10.3.6.2. Market Estimates & Forecast, by Category, 2020–2027

10.3.6.3. Market Estimates & Forecast, by Mode of Action, 2020–2027

10.3.6.4. Market Estimates & Forecast, by Crop Type, 2020–2027

10.3.7. UK

10.3.7.1. Market Estimates & Forecast, by Active Ingredient, 2020–2027

10.3.7.2. Market Estimates & Forecast, by Category, 2020–2027

10.3.7.3. Market Estimates & Forecast, by Mode of Action, 2020–2027

10.3.7.4. Market Estimates & Forecast, by Crop Type, 2020–2027

10.3.8. France

10.3.8.1. Market Estimates & Forecast, by Active Ingredient, 2020–2027

10.3.8.2. Market Estimates & Forecast, by Category, 2020–2027

10.3.8.3. Market Estimates & Forecast, by Mode of Action, 2020–2027

10.3.8.4. Market Estimates & Forecast, by Crop Type, 2020–2027

10.3.9. Spain

10.3.9.1. Market Estimates & Forecast, by Active Ingredient, 2020–2027

10.3.9.2. Market Estimates & Forecast, by Category, 2020–2027

10.3.9.3. Market Estimates & Forecast, by Mode of Action, 2020–2027

10.3.9.4. Market Estimates & Forecast, by Crop Type, 2020–2027

10.3.10. Italy

10.3.10.1. Market Estimates & Forecast, by Active Ingredient, 2020–2027

10.3.10.2. Market Estimates & Forecast, by Category, 2020–2027

10.3.10.3. Market Estimates & Forecast, by Mode of Action, 2020–2027

10.3.10.4. Market Estimates & Forecast, by Crop Type, 2020–2027

10.3.11. Rest of Europe

10.3.11.1. Market Estimates & Forecast, by Active Ingredient, 2020–2027

10.3.11.2. Market Estimates & Forecast, by Category, 2020–2027

10.3.11.3. Market Estimates & Forecast, by Mode of Action, 2020–2027

10.3.11.4. Market Estimates & Forecast, by Crop Type, 2020–2027

10.4. Asia-Pacific

10.4.1. Market Estimates & Forecast, by Active Ingredient, 2020–2027

10.4.2. Market Estimates & Forecast, by Category, 2020–2027

10.4.3. Market Estimates & Forecast, by Mode of Action, 2020–2027

10.4.4. Market Estimates & Forecast, by Crop Type, 2020–2027

10.4.5. Market Estimates & Forecast, by Country, 2020–2027

10.4.6. China

10.4.6.1. Market Estimates & Forecast, by Active Ingredient, 2020–2027

10.4.6.2. Market Estimates & Forecast, by Category, 2020–2027

10.4.6.3. Market Estimates & Forecast, by Mode of Action, 2020–2027

10.4.6.4. Market Estimates & Forecast, by Crop Type, 2020–2027

10.4.7. Japan

10.4.7.1. Market Estimates & Forecast, by Active Ingredient, 2020–2027

10.4.7.2. Market Estimates & Forecast, by Category, 2020–2027

10.4.7.3. Market Estimates & Forecast, by Mode of Action, 2020–2027

10.4.7.4. Market Estimates & Forecast, by Crop Type, 2020–2027

10.4.8. India

10.4.8.1. Market Estimates & Forecast, by Active Ingredient, 2020–2027

10.4.8.2. Market Estimates & Forecast, by Category, 2020–2027

10.4.8.3. Market Estimates & Forecast, by Mode of Action, 2020–2027

10.4.8.4. Market Estimates & Forecast, by Crop Type, 2020–2027

10.4.9. Australia & New Zealand

10.4.9.1. Market Estimates & Forecast, by Active Ingredient, 2020–2027

10.4.9.2. Market Estimates & Forecast, by Category, 2020–2027

10.4.9.3. Market Estimates & Forecast, by Mode of Action, 2020–2027

10.4.9.4. Market Estimates & Forecast, by Crop Type, 2020–2027

10.4.10. Rest of Asia-Pacific

10.4.10.1. Market Estimates & Forecast, by Active Ingredient, 2020–2027

10.4.10.2. Market Estimates & Forecast, by Category, 2020–2027

10.4.10.3. Market Estimates & Forecast, by Mode of Action, 2020–2027

10.4.10.4. Market Estimates & Forecast, by Crop Type, 2020–2027

10.5. Rest of the World

10.5.1. Market Estimates & Forecast, by Active Ingredient, 2020–2027

10.5.2. Market Estimates & Forecast, by Category, 2020–2027

10.5.3. Market Estimates & Forecast, by Mode of Action, 2020–2027

10.5.4. Market Estimates & Forecast, by Crop Type, 2020–2027

10.5.5. Market Estimates & Forecast, by Region, 2020–2027

10.5.6. South America

10.5.6.1. Market Estimates & Forecast, by Active Ingredient, 2020–2027

10.5.6.2. Market Estimates & Forecast, by Category, 2020–2027

10.5.6.3. Market Estimates & Forecast, by Mode of Action, 2020–2027

10.5.6.4. Market Estimates & Forecast, by Crop Type, 2020–2027

10.5.7. Middle East

10.5.7.1. Market Estimates & Forecast, by Active Ingredient, 2020–2027

10.5.7.2. Market Estimates & Forecast, by Category, 2020–2027

10.5.7.3. Market Estimates & Forecast, by Mode of Action, 2020–2027

10.5.7.4. Market Estimates & Forecast, by Crop Type, 2020–2027

10.5.8. Africa

10.5.8.1. Market Estimates & Forecast, by Active Ingredient, 2020–2027

10.5.8.2. Market Estimates & Forecast, by Category, 2020–2027

10.5.8.3. Market Estimates & Forecast, by Mode of Action, 2020–2027

10.5.8.4. Market Estimates & Forecast, by Crop Type, 2020–2027

11. COMPETITIVE LANDSCAPE

11.1. Introduction

11.2. Competitive Benchmarking

11.3. Development Share Analysis

11.4. Key Developments & Growth Strategies

12. COMPANY PROFILES

12.1. BASF SE

12.1.1. Company Overview

12.1.2. Financial Overview

12.1.3. Products Offered

12.1.4. Key Developments

12.1.5. SWOT Analysis

12.1.6. Key Strategies

12.2. The Dow Chemical Company

12.2.1. Company Overview

12.2.2. Financial Overview

12.2.3. Products Offered

12.2.4. Key Developments

12.2.5. SWOT Analysis

12.2.6. Key Strategies

12.3. Monsanto Company

12.3.1. Company Overview

12.3.2. Financial Overview

12.3.3. Products Offered

12.3.4. Key Developments

12.3.5. SWOT Analysis

12.3.6. Key Strategies

12.4. FMC Corporation

12.4.1. Company Overview

12.4.2. Financial Overview

12.4.3. Products Offered

12.4.4. Key Developments

12.4.5. SWOT Analysis

12.4.6. Key Strategies

12.5. Bayer AG

12.5.1. Company Overview

12.5.2. Financial Overview

12.5.3. Products Offered

12.5.4. Key Developments

12.5.5. SWOT Analysis

12.5.6. Key Strategies

12.6. Agrium Inc

12.6.1. Company Overview

12.6.2. Financial Overview

12.6.3. Products Offered

12.6.4. Key Developments

12.6.5. SWOT Analysis

12.6.6. Key Strategies

12.7. PI Industries

12.7.1. Company Overview

12.7.2. Financial Overview

12.7.3. Products Offered

12.7.4. Key Developments

12.7.5. SWOT Analysis

12.7.6. Key Strategies

12.8. Syngenta AG

12.8.1. Company Overview

12.8.2. Financial Overview

12.8.3. Products Offered

12.8.4. Key Developments

12.8.5. SWOT Analysis

12.8.6. Key Strategies

12.9. Element Solutions Inc

12.9.1. Company Overview

12.9.2. Financial Overview

12.9.3. Products Offered

12.9.4. Key Developments

12.9.5. SWOT Analysis

12.9.6. Key Strategies

12.10. Nufarm Limited

12.10.1. Company Overview

12.10.2. Financial Overview

12.10.3. Products Offered

12.10.4. Key Developments

12.10.5. SWOT Analysis

12.10.6. Key Strategies

12.11. Nissan Chemical Industries Ltd.

12.11.1. Company Overview

12.11.2. Financial Overview

12.11.3. Products Offered

12.11.4. Key Developments

12.11.5. SWOT Analysis

12.11.6. Key Strategies

12.12. Drexel Chemical Company

12.12.1. Company Overview

12.12.2. Financial Overview

12.12.3. Products Offered

12.12.4. Key Developments

12.12.5. SWOT Analysis

12.12.6. Key Strategies

12.13. ADAMA Ltd.

12.13.1. Company Overview

12.13.2. Financial Overview

12.13.3. Products Offered

12.13.4. Key Developments

12.13.5. SWOT Analysis

12.13.6. Key Strategies

12.14. Kenvos Bio

12.14.1. Company Overview

12.14.2. Financial Overview

12.14.3. Products Offered

12.14.4. Key Developments

12.14.5. SWOT Analysis

12.14.6. Key Strategies

12.15. UPL

12.15.1. Company Overview

12.15.2. Financial Overview

12.15.3. Products Offered

12.15.4. Key Developments

12.15.5. SWOT Analysis

12.15.6. Key Strategies

13. APPENDIX

13.1. General Sources & References

13.2. List of Abbreviation

LIST OF TABLES

Table 1 Global Herbicides Market, by Region, 2020–2027 (USD Million)

Table 2 Global Herbicides Market, by Active Ingredient, 2020–2027 (USD Million)

Table 3 Global Herbicides Market, by Category,2020–2027 (USD Million)

Table 4 Global Herbicides Market, by Mode of Action, 2020–2027 (USD Million)

Table 5 Global Herbicides Market, by Crop Type, 2020–2027 (USD Million)

Table 6 North America: Herbicides Market, by Country, 2020–2027 (USD Million)

Table 7 North America: Herbicides Market, by Active Ingredient, 2020–2027 (USD Million)

Table 8 North America: Herbicides Market, by Category,2020–2027 (USD Million)

Table 9 North America: Herbicides Market, by Mode of Action, 2020–2027 (USD Million)

Table 10 North America: Herbicides Market, by Crop Type, 2020–2027 (USD Million)

Table 11 US: Herbicides Market, by Active Ingredient, 2020–2027 (USD Million)

Table 12 US: Herbicides Market, by Category,2020–2027 (USD Million)

Table 13 US: Herbicides Market, by Mode of Action, 2020–2027 (USD Million)

Table 14 US: Herbicides Market, by Crop Type, 2020–2027 (USD Million)

Table 15 Canada: Herbicides Market, by Active Ingredient, 2020–2027 (USD Million)

Table 16 Canada: Herbicides Market, by Category,2020–2027 (USD Million)

Table 17 Canada: Herbicides Market, by Mode of Action, 2020–2027 (USD Million)

Table 18 Canada: Herbicides Market, by Crop Type, 2020–2027 (USD Million)

Table 19 Mexico: Herbicides Market, by Active Ingredient, 2020–2027 (USD Million)

Table 20 Mexico: Herbicides Market, by Category,2020–2027 (USD Million)

Table 21 Mexico: Herbicides Market, by Mode of Action, 2020–2027 (USD Million)

Table 22 Mexico: Herbicides Market, by Crop Type, 2020–2027 (USD Million)

Table 23 Europe: Herbicides Market, by Country, 2020–2027 (USD Million)

Table 24 Europe: Herbicides Market, by Active Ingredient, 2020–2027 (USD Million)

Table 25 Europe: Herbicides Market, by Category,2020–2027 (USD Million)

Table 26 Europe: Herbicides Market, by Mode of Action, 2020–2027 (USD Million)

Table 27 Europe: Herbicides Market, by Crop Type, 2020–2027 (USD Million)

Table 28 Germany: Herbicides Market, by Active Ingredient, 2020–2027 (USD Million)

Table 29 Germany: Herbicides Market, by Category,2020–2027 (USD Million)

Table 30 Germany: Herbicides Market, by Mode of Action, 2020–2027 (USD Million)

Table 31 Germany: Herbicides Market, by Crop Type, 2020–2027 (USD Million)

Table 32 France: Herbicides Market, by Active Ingredient, 2020–2027 (USD Million)

Table 33 France: Herbicides Market, by Category,2020–2027 (USD Million)

Table 34 France: Herbicides Market, by Mode of Action, 2020–2027 (USD Million)

Table 35 France: Herbicides Market, by Crop Type, 2020–2027 (USD Million)

Table 36 Italy: Herbicides Market, by Active Ingredient, 2020–2027 (USD Million)

Table 37 Italy: Herbicides Market, by Category,2020–2027 (USD Million)

Table 38 Italy: Herbicides Market, by Mode of Action, 2020–2027 (USD Million)

Table 39 Italy: Herbicides Market, by Crop Type, 2020–2027 (USD Million)

Table 40 Spain: Herbicides Market, by Active Ingredient, 2020–2027 (USD Million)

Table 41 Spain: Herbicides Market, by Category,2020–2027 (USD Million)

Table 42 Spain: Herbicides Market, by Mode of Action, 2020–2027 (USD Million)

Table 43 Spain: Herbicides Market, by Crop Type, 2020–2027 (USD Million)

Table 44 UK: Herbicides Market, by Active Ingredient, 2020–2027 (USD Million)

Table 45 UK: Herbicides Market, by Category,2020–2027 (USD Million)

Table 46 UK: Herbicides Market, by Mode of Action, 2020–2027 (USD Million)

Table 47 UK: Herbicides Market, by Crop Type, 2020–2027 (USD Million)

Table 48 Rest of Europe: Herbicides Market, by Active Ingredient, 2020–2027 (USD Million)

Table 49 Rest of Europe: Herbicides Market, by Category,2020–2027 (USD Million)

Table 50 Rest of Europe: Herbicides Market, by Mode of Action, 2020–2027 (USD Million)

Table 51 Rest of Europe: Herbicides Market, by Crop Type, 2020–2027 (USD Million)

Table 52 Asia-Pacific: Herbicides Market, by Country, 2020–2027 (USD Million)

Table 53 Asia-Pacific: Herbicides Market, by Active Ingredient, 2020–2027 (USD Million)

Table 54 Asia-Pacific: Herbicides Market, by Category,2020–2027 (USD Million)

Table 55 Asia-Pacific: Herbicides Market, by Mode of Action, 2020–2027 (USD Million)

Table 56 Asia-Pacific: Herbicides Market, by Crop Type, 2020–2027 (USD Million)

Table 57 China: Herbicides Market, by Active Ingredient, 2020–2027 (USD Million)

Table 58 China: Herbicides Market, by Category,2020–2027 (USD Million)

Table 59 China: Herbicides Market, by Mode of Action, 2020–2027 (USD Million)

Table 60 China: Herbicides Market, by Crop Type, 2020–2027 (USD Million)

Table 61 India: Herbicides Market, by Active Ingredient, 2020–2027 (USD Million)

Table 62 India: Herbicides Market, by Category,2020–2027 (USD Million)

Table 63 India: Herbicides Market, by Mode of Action, 2020–2027 (USD Million)

Table 64 India: Herbicides Market, by Crop Type, 2020–2027 (USD Million)

Table 65 Japan: Herbicides Market, by Active Ingredient, 2020–2027 (USD Million)

Table 66 Japan: Herbicides Market, by Category,2020–2027 (USD Million)

Table 67 Japan: Herbicides Market, by Mode of Action, 2020–2027 (USD Million)

Table 68 Japan: Herbicides Market, by Crop Type, 2020–2027 (USD Million)

Table 69 Australia & New Zealand: Herbicides Market, by Active Ingredient, 2020–2027 (USD Million)

Table 70 Australia & New Zealand: Herbicides Market, by Category,2020–2027 (USD Million)

Table 71 Australia & New Zealand: Herbicides Market, by Mode of Action, 2020–2027 (USD Million)

Table 72 Australia & New Zealand: Herbicides Market, by Crop Type, 2020–2027 (USD Million)

Table 73 Rest of Asia-Pacific: Herbicides Market, by Active Ingredient, 2020–2027 (USD Million)

Table 74 Rest of Asia-Pacific: Herbicides Market, by Category,2020–2027 (USD Million)

Table 75 Rest of Asia-Pacific: Herbicides Market, by Mode of Action, 2020–2027 (USD Million)

Table 76 Rest of Asia-Pacific: Herbicides Market, by Crop Type, 2020–2027 (USD Million)

Table 77 Rest of the World (RoW): Herbicides Market, by Country, 2020–2027 (USD Million)

Table 78 Rest of the World (RoW): Herbicides Market, by Active Ingredient, 2020–2027 (USD Million)

Table 79 Rest of the World (RoW): Herbicides Market, by Category,2020–2027 (USD Million)

Table 80 Rest of the World (RoW): Herbicides Market, by Mode of Action, 2020–2027 (USD Million)

Table 81 Rest of the World (RoW): Herbicides Market, by Crop Type, 2020–2027 (USD Million)

Table 82 South America: Herbicides Market, by Active Ingredient, 2020–2027 (USD Million)

Table 83 South America: Herbicides Market, by Category,2020–2027 (USD Million)

Table 84 South America: Herbicides Market, by Mode of Action, 2020–2027 (USD Million)

Table 85 South America: Herbicides Market, by Crop Type, 2020–2027 (USD Million)

Table 86 Middle East: Herbicides Market, by Active Ingredient, 2020–2027 (USD Million)

Table 87 Middle East: Herbicides Market, by Category,2020–2027 (USD Million)

Table 88 Middle East: Herbicides Market, by Mode of Action, 2020–2027 (USD Million)

Table 89 Middle East: Herbicides Market, by Crop Type, 2020–2027 (USD Million)

Table 90 Africa: Herbicides Market, by Active Ingredient, 2020–2027 (USD Million)

Table 91 Africa: Herbicides Market, by Category,2020–2027 (USD Million)

Table 92 Africa: Herbicides Market, by Mode of Action, 2020–2027 (USD Million)

Table 93 Africa: Herbicides Market, by Crop Type, 2020–2027 (USD Million)

LIST OF FIGURES

FIGURE 1 Global 
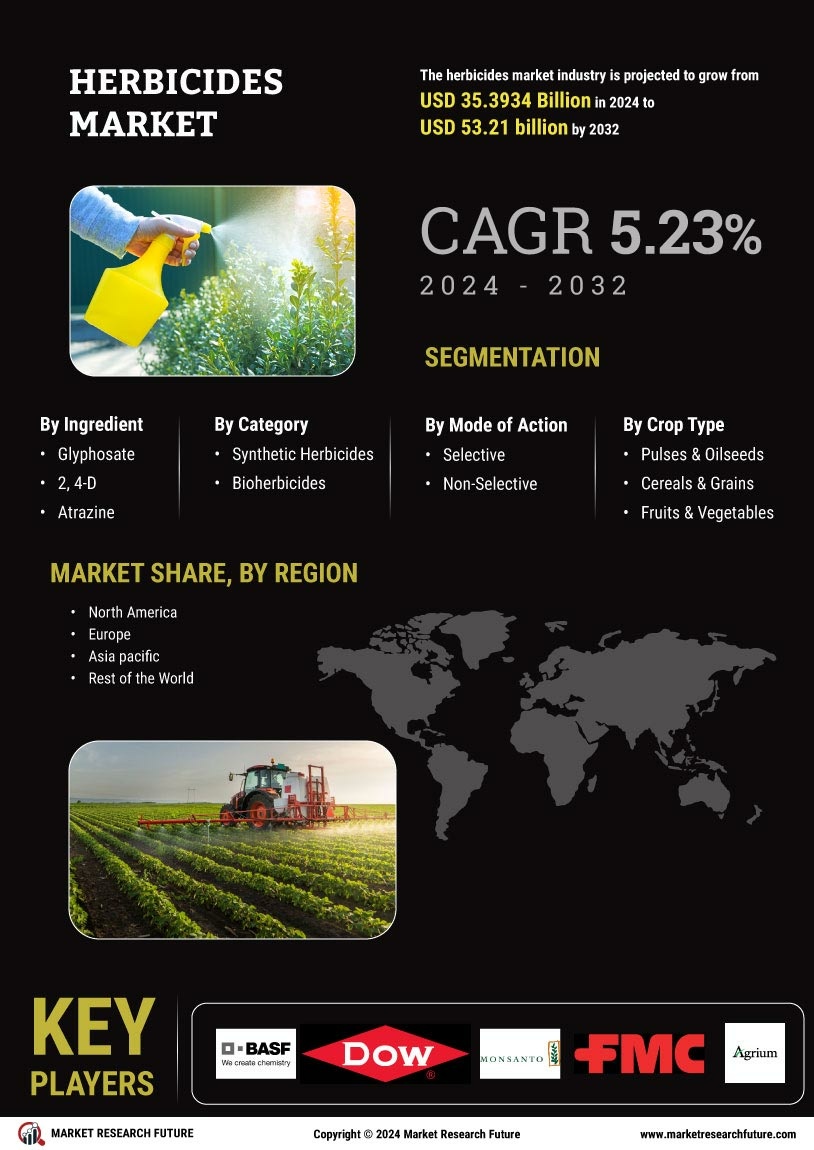
Herbicides Market Segmentation

FIGURE 2 Forecast Research Methodology

FIGURE 3 Five Forces Analysis of Global Herbicides Market

FIGURE 4 Value Chain of the Global Herbicides Market

FIGURE 5 Share of the Global Herbicides Market in 2020, by Country (%)

FIGURE 6 Global Herbicides Market, by Region, 2020–2027,

FIGURE 7 Global Herbicides Market Size, by Active Ingredient, 2020

FIGURE 8 Share of the Global Herbicides Market, by Active Ingredient, 2020–2027 (%)

FIGURE 9 Global Herbicides Market Size, by Category, 2020

FIGURE 10 Share of the Global Herbicides Market, by Category, 2020–2027 (%)

FIGURE 9 Global Herbicides Market Size, by Mode of Action, 2020

FIGURE 10 Share of the Global Herbicides Market, by Mode of Action, 2020–2027 (%)

FIGURE 9 Global Herbicides Market Size, by Crop Type, 2020

FIGURE 10 Share of the Global Herbicides Market, by Crop Type, 2020–2027 (%)