Healthcare Regulatory Affairs Outsourcing Market (2026 - 2035)

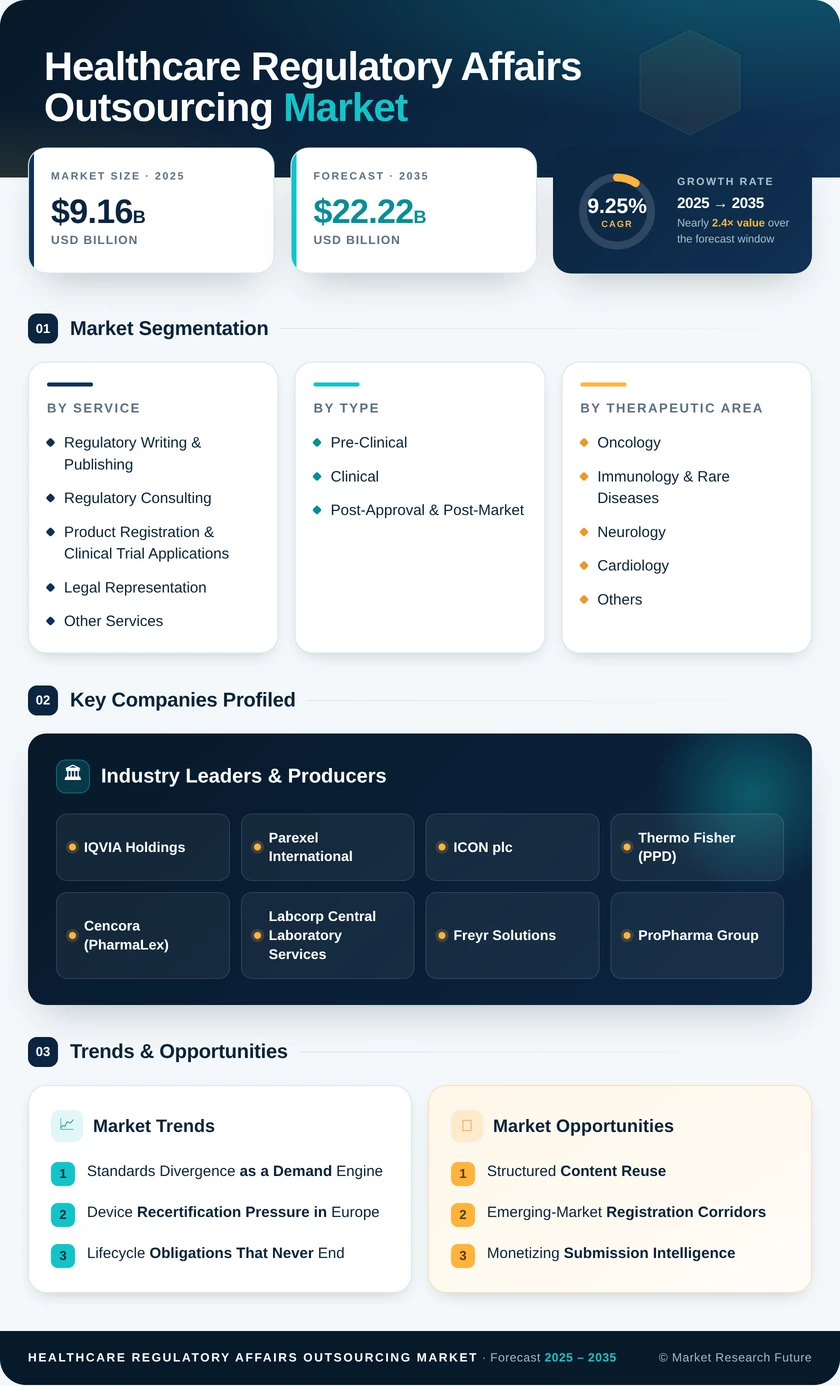
Healthcare Regulatory Affairs Outsourcing Market Research Report: Size, Share, Trend Analysis By Service (Regulatory Writing and Publishing, Regulatory Submissions, Clinical Trial Applications and Services Registrations, Regulatory Consulting and Legal Representation, and Other Regulatory Affairs), By End Users (Mid-Size Pharmaceutical Companies, Large Pharmaceutical Companies, Biotechnology Companies, Medical Device Companies, and Food and Beverage Companies), and By Region (North America, Europe, Asia-Pacific, and Rest Of The World) - Growth Outlook & Industry Forecast 2025 To 2035

Forecast Period
2026-2035
CAGR
9.25%
2025 Market Size
USD 9.16 Billion
2035 Market Size
USD 22.22 Billion
Healthcare ● Updated August 24, 2026 Report ID: MRFR/HC/6334-HCR | Pages: 90 | Author: Vikita Thakur, Kinjoll Dey
  1. 1 Market Overview |
    1. 1.1 Study Assumptions & Market Definition |
    2. 1.2 Scope of the Study |
    3. 1.3 Research Methodology
  2. 2 Market Summary & Key Report Takeaways
  3. 3 Market Size & Forecast (2021–2035) |
    1. 3.1 Historical Market Size (2021–2025) |
    2. 3.2 Current & Forecast Market Size (2026–2035) |
    3. 3.3 Market Size by Revenue (USD Billion) |
    4. 3.4 Year-over-Year Growth Analysis
  4. 4 Driver Impact Analysis |
    1. 4.1 Capital-Rich, Headcount-Poor Sponsors |
    2. 4.2 Standards Divergence as a Demand Engine |
    3. 4.3 Device Recertification Pressure in Europe |
    4. 4.4 Lifecycle Obligations That Never End
  5. 5 Restraints Impact Analysis |
    1. 5.1 Data Residency Complicates Offshore Delivery |
    2. 5.2 Strategic Work Comes Back In-House |
    3. 5.3 The Talent Bottleneck
  6. 6 Opportunity Analysis |
    1. 6.1 Structured Content Reuse |
    2. 6.2 Emerging-Market Registration Corridors |
    3. 6.3 Monetizing Submission Intelligence |
    4. 6.4 Device and Diagnostics Whitespace |
    5. 6.5 Regulatory Operations as Managed Service |
    6. 6.6 Industry Value Chain Analysis |
    7. 6.7 Porter's Five Forces Analysis
  7. 7 Regional Market Share & Country-Level Analysis |
    1. 7.1 North America | |
      1. 7.1.1 US | |
      2. 7.1.2 Canada | |
      3. 7.1.3 Mexico |
    2. 7.2 Europe | |
      1. 7.2.1 Germany | |
      2. 7.2.2 UK | |
      3. 7.2.3 France | |
      4. 7.2.4 Italy | |
      5. 7.2.5 Spain | |
      6. 7.2.6 Nordic Countries | |
      7. 7.2.7 Russia | |
      8. 7.2.8 Rest of Europe |
    3. 7.3 Asia-Pacific | |
      1. 7.3.1 China | |
      2. 7.3.2 India | |
      3. 7.3.3 Japan | |
      4. 7.3.4 South Korea | |
      5. 7.3.5 ASEAN | |
      6. 7.3.6 Rest of Asia-Pacific |
    4. 7.4 South America | |
      1. 7.4.1 Brazil | |
      2. 7.4.2 Argentina | |
      3. 7.4.3 Rest of South America |
    5. 7.5 Middle East & Africa | |
      1. 7.5.1 Saudi Arabia | |
      2. 7.5.2 UAE | |
      3. 7.5.3 South Africa | |
      4. 7.5.4 Egypt | |
      5. 7.5.5 Rest of Middle East & Africa
  8. 8 Future Outlook (2026–2035) |
    1. 8.1 Machine-Assisted Authoring Becomes Table Stakes |
    2. 8.2 Platform Economics Reshape Vendor Margins |
    3. 8.3 Convergence Arrives Unevenly |
    4. 8.4 Evidence Obligations Outlive Patents
  9. 9 Market Segmentation Analysis |
    1. 9.1 By Service | |
      1. 9.1.1 Regulatory Consulting | |
      2. 9.1.2 Regulatory Writing & Publishing | |
      3. 9.1.3 Product Registration & Clinical Trial Applications | |
      4. 9.1.4 Legal Representation | |
      5. 9.1.5 Labeling & Artwork Management | |
      6. 9.1.6 Post- Maker/ Lifecycle Management | |
      7. 9.1.7 Other Services |
    2. 9.2 By Product Lifecycle Stage | |
      1. 9.2.1 Pre-Clinical | |
      2. 9.2.2 Clinical | |
      3. 9.2.3 Post-Approval & Post-Market | |
      4. 9.2.4 Registration |
    3. 9.3 By Therapeutic Area | |
      1. 9.3.1 Oncology | |
      2. 9.3.2 Neurology | |
      3. 9.3.3 Cardiology | |
      4. 9.3.4 Immunology & Rare Diseases | |
      5. 9.3.5 Infectious Diseases | |
      6. 9.3.6 Other Therapeutic Areas |
    4. 9.4 By End User | |
      1. 9.4.1 Pharmaceutical Companies | |
      2. 9.4.2 Biotechnology Companies | |
      3. 9.4.3 Medical Device Manufacturers | |
      4. 9.4.4 Contract- Research & Manufacturing Organisations | |
      5. 9.4.5 Other End Users
  10. 10 Competitive Landscape |
    1. 10.1 Market Share Analysis (2026) |
    2. 10.2 Competitive Benchmarking Matrix |
    3. 10.3 Company Profiles | |
      1. 10.3.1 IQVIA Holdings | |
      2. 10.3.2 Parexel International | |
      3. 10.3.3 ICON plc | |
      4. 10.3.4 Thermo Fisher Scientific (PPD) | |
      5. 10.3.5 Cencora (PharmaLex) | |
      6. 10.3.6 Labcorp Central Laboratory Services | |
      7. 10.3.7 Freyr Solutions | |
      8. 10.3.8 ProPharma Group | |
      9. 10.3.9 Genpact | |
      10. 10.3.10 Emergo by UL Solutions | |
      11. 10.3.11 Medpace Holdings | |
      12. 10.3.12 WuXi AppTec
  11. 11 Recent News & Developments
  12. 12 Report Scope & Methodology |
    1. 12.1 Study Period & Base Year |
    2. 12.2 Data Sources & Citations |
    3. 12.3 Abbreviations
  13. 13 Detailed Sources & Citations
  14. 14 Frequently Asked Questions
  15. 15 LIST OF TABLES |
  16. TABLE 1 Global Healthcare Regulatory Affairs Outsourcing Market Size & Forecast, by Revenue (USD Billion), 2021–2035 |
  17. TABLE 2 Year-over-Year Growth Analysis, 2021–2035 |
  18. TABLE 3 Driver Impact Analysis Matrix, 2026–2035 |
  19. TABLE 4 Restraint Impact Analysis Matrix, 2026–2035 |
  20. TABLE 5 Market Size, by Service, 2021–2035 (USD Billion) |
  21. TABLE 6 Market Size, by Product Lifecycle Stage, 2021–2035 (USD Billion) |
  22. TABLE 7 Market Size, by Therapeutic Area, 2021–2035 (USD Billion) |
  23. TABLE 8 Market Size, by End User, 2021–2035 (USD Billion) |
  24. TABLE 9 Market Size, by Region, 2021–2035 (USD Billion) |
  25. TABLE 10 North America Market Size, by Country, 2021–2035 (USD Billion) |
  26. TABLE 11 Europe Market Size, by Country, 2021–2035 (USD Billion) |
  27. TABLE 12 Asia-Pacific Market Size, by Country, 2021–2035 (USD Billion) |
  28. TABLE 13 South America Market Size, by Country, 2021–2035 (USD Billion) |
  29. TABLE 14 Middle East & Africa Market Size, by Country, 2021–2035 (USD Billion) |
  30. TABLE 15 North America Market Size, by Service, 2021–2035 (USD Billion) |
  31. TABLE 16 Europe Market Size, by Service, 2021–2035 (USD Billion) |
  32. TABLE 17 Asia-Pacific Market Size, by Service, 2021–2035 (USD Billion) |
  33. TABLE 18 North America Market Size, by End User, 2021–2035 (USD Billion) |
  34. TABLE 19 Europe Market Size, by End User, 2021–2035 (USD Billion) |
  35. TABLE 20 Asia-Pacific Market Size, by End User, 2021–2035 (USD Billion) |
  36. TABLE 21 Competitive Benchmarking Matrix, 2026 |
  37. TABLE 22 Company Profiles — Key Players |
  38. TABLE 23 Recent Developments & Strategic Announcements, 2023–2025 |
  39. TABLE 24 Report Scope & Methodology Summary |
  40. TABLE 25 Detailed Sources & Citations
  41. 16 LIST OF FIGURES |
  42. FIGURE 1 Market Dynamics — Drivers, Restraints and Opportunities Overview |
  43. FIGURE 2 Industry Value Chain Analysis |
  44. FIGURE 3 Porter's Five Forces Analysis |
  45. FIGURE 4 Global Market Size Trend, 2021–2035 (USD Billion) |
  46. FIGURE 5 Year-over-Year Growth Trend, 2022–2035 (%) |
  47. FIGURE 6 Revenue Share by Service, 2025 vs 2035 (%) |
  48. FIGURE 7 Revenue Share by Product Lifecycle Stage, 2025 (%) |
  49. FIGURE 8 Revenue Share by Therapeutic Area, 2025 (%) |
  50. FIGURE 9 Revenue Share by End User, 2025 (%) |
  51. FIGURE 10 Regional Revenue Share, 2025 (%) |
  52. FIGURE 11 Regional CAGR Comparison, 2026–2035 (%) |
  53. FIGURE 12 North America Country-Level Share, 2025 (%) |
  54. FIGURE 13 Europe Country-Level Share, 2025 (%) |
  55. FIGURE 14 Asia-Pacific Country-Level Share, 2025 (%) |
  56. FIGURE 15 Competitive Landscape — Estimated Revenue Share Ranges, 2026 |
  57. FIGURE 16 Vendor Positioning Matrix — Scale vs Specialization

Segmentation Quick Reference

DimensionSub-SegmentsDominant SegmentFastest Growing Segment
By ServiceRegulatory Consulting; Regulatory Writing & Publishing; Product Registration & Clinical Trial Applications; Legal Representation; Other ServicesRegulatory Writing & PublishingProduct Registration & Clinical Trial Applications
By Product Lifecycle StagePre-Clinical; Clinical; Post-Approval & Post-MarketClinicalPost-Approval & Post-Market
By Therapeutic AreaOncology; Neurology; Cardiology; Immunology & Rare Diseases; Other Therapeutic AreasOncologyImmunology & Rare Diseases
By End UserPharmaceutical Companies; Biotechnology Companies; Medical Device Manufacturers; Other End UsersPharmaceutical CompaniesMedical Device Manufacturers
By GeographyNorth America; Europe; Asia-Pacific; South America; Middle East & AfricaNorth AmericaAsia-Pacific


Market Segmentation Overview

By Service

Sub-SegmentKey Trend
Regulatory ConsultingSponsors retain strategy internally while buying jurisdictional judgement on demand.
Regulatory Writing & PublishingStructured content authoring displaces document-centric workflows.
Product Registration & Clinical Trial ApplicationsParallel multi-market launches multiply application volume per asset.
Legal RepresentationMandatory in-country representative rules sustain steady low-ticket demand.
Other ServicesLabelling, translation and archiving bundle into managed-service contracts


Service mix is drifting from hourly execution toward contracted outcomes. Providers that can guarantee submission acceptance dates, rather than page throughput, are pricing above the market average and defending margin against offshore competition.

By Product Lifecycle Stage

Sub-SegmentKey Trend
Pre-ClinicalEarly scientific advice packages become an entry wedge for vendors.
ClinicalMultinational trial applications drive the largest single block of activity.
Post-Approval & Post-MarketVariations, safety reporting and evidence generation convert to annuities.


Lifecycle economics increasingly favour the back end. A product approved in 2026 will generate maintenance filings into the late 2030s, which is why vendors compete hardest for the initial clinical engagement that secures the downstream relationship.

By Therapeutic Area

Sub-SegmentKey Trend
OncologyAccelerated pathways compress timelines and raise documentation intensity
NeurologyEndpoint justification demands specialist medical writing.
CardiologyLarge outcome trials generate heavy data-package workloads.
Immunology & Rare DiseasesOrphan sponsors outsource almost the entire regulatory function.
Other Therapeutic AreasInfectious disease and metabolic programs sustain baseline volume.


Therapeutic concentration mirrors pipeline concentration. Vendors with credentialed oncology and rare-disease writers command premium rates, and sponsors in these areas rarely switch providers mid-program.

By End User

Sub-SegmentKey Trend
Pharmaceutical CompaniesExecution outsourced, strategy retained in-house
Biotechnology CompaniesFull-function dependency from first-in-human onward
Medical Device ManufacturersMDR and IVDR remediation creates urgent specialist demand
Other End UsersAcademic sponsors and distributors buy episodic support.


End-user needs are diverging sharply. Device and diagnostics buyers want technical documentation and notified-body liaison, while biotech buyers want a complete outsourced department — a split that increasingly separates specialist providers from generalists.




Download PDF ×

We do not share your information with anyone. However, we may send you emails based on your report interest from time to time. You may contact us at any time to opt-out.