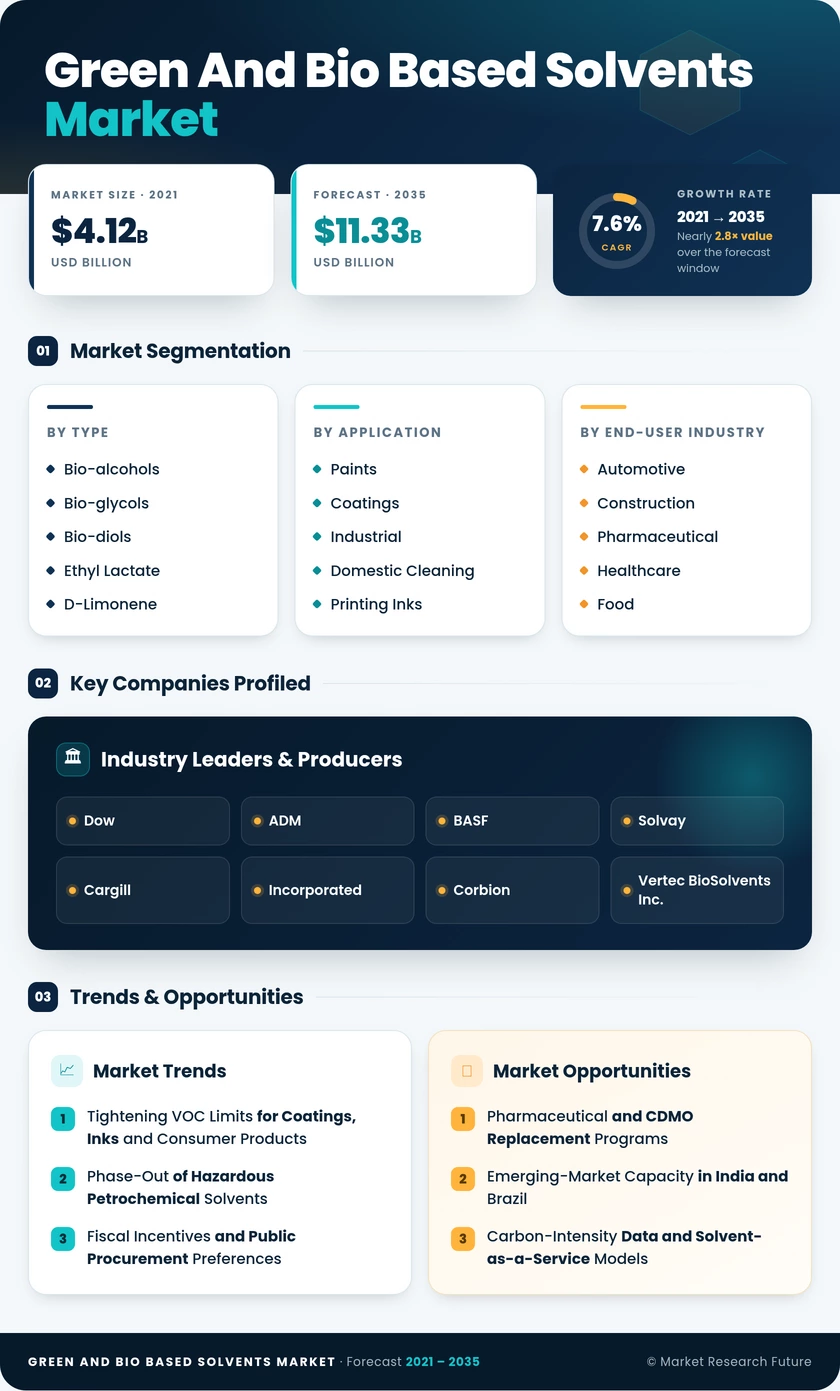
Green and Bio-Based Solvents Market (2026 - 2035)

ID: MRFR/CnM/6399-HCR 111 Pages Chitranshi Jaiswal Last Updated: October 27, 2026
Green and Bio-Based Solvents Market Research Report Information By Type (Bio-Alcohols (Bio-Ethanol, Bio-Methanol, Bio-Propanol, and Bio-Butanol), Bio-Glycols (Bio-Based Propylene Glycol and Bio-Based Ethylene Glycol), Bio-Diols, Ethyl Lactate, D-Limonene, Methyl Soyate, and Other Types), By Application (Paints and Coatings, Industrial and Domestic Cleaning, Printing Inks, Adhesives and Sealants, Pharmaceuticals, Cosmetics and Personal Care, Agriculture, and Other Applications), By End-User Industry (Automotive, Construction, Pharmaceutical and Healthcare, Food and Beverages, Consumer Goods, Agriculture, Electronics, and Others), And By Region (North America, Europe, Asia-Pacific, and Rest of the World) – Market Forecast Till 2035.
Green and Bio-Based Solvents Market
Market Size
Forecast Period2026-2035
CAGR (2026-2035)7.6%
2025 Market SizeUSD 5.46 Billion
2035 Market SizeUSD 11.33 Billion
Key Players
Dow
ADM
BASF
Solvay
Cargill
Incorporated
Opportunities
  • Pharmaceutical and CDMO Replacement Programs
  • Emerging-Market Capacity in India and Brazil
  • Carbon-Intensity Data and Solvent-as-a-Service Models
  1. 1 Market Summary | |
  2. 2 Key Report Takeaways | |
    1. 2.1 By Type | |
    2. 2.2 By Application | |
    3. 2.3 By End-User Industry | |
    4. 2.4 By Region | |
  3. 3 Market Size and Forecast (2021–2035) | |
    1. 3.1 Historical Market Size (2021–2025) | |
    2. 3.2 Forecast Market Size (2026–2035) | |
    3. 3.3 Year-over-Year Growth Analysis | |
  4. 4 Driver Impact Analysis | |
    1. 4.1 Tightening VOC Limits for Coatings, Inks and Consumer Products | |
    2. 4.2 Phase-Out of Hazardous Petrochemical Solvents | |
    3. 4.3 Fiscal Incentives and Public Procurement Preferences | |
    4. 4.4 Pharmaceutical Solvent Substitution | |
    5. 4.5 Corporate Decarbonization and Supplier Disclosure | |
    6. 4.6 Bio-Refinery Capacity and Feedstock Diversification | |
  5. 5 Restraints Impact Analysis | |
    1. 5.1 Price Premium over Petrochemical Equivalents | |
    2. 5.2 Feedstock Price and Supply Volatility | |
    3. 5.3 Performance Gaps in High-Solvency Applications | |
    4. 5.4 Land-Use and Food-versus-Fuel Scrutiny | |
    5. 5.5 Fragmented Certification and Bio-Content Standards | |
  6. 6 Opportunities | |
    1. 6.1 Pharmaceutical and CDMO Replacement Programs | |
    2. 6.2 Emerging-Market Capacity in India and Brazil | |
    3. 6.3 Carbon-Intensity Data and Solvent-as-a-Service Models | |
    4. 6.4 High-Purity Electronics Cleaning | |
    5. 6.5 Waste-Derived Feedstocks | |
  7. 7 Regional Market Share and Country-Level Analysis | |
    1. 7.1 Asia Pacific | | |
      1. 7.1.1 China | | |
      2. 7.1.2 India | | |
      3. 7.1.3 Japan | | |
      4. 7.1.4 South Korea | | |
      5. 7.1.5 Rest of Asia-Pacific | |
    2. 7.2 North America | | |
      1. 7.2.1 United States | | |
      2. 7.2.2 Canada | | |
      3. 7.2.3 Mexico | |
    3. 7.3 Europe | | |
      1. 7.3.1 Germany | | |
      2. 7.3.2 United Kingdom | | |
      3. 7.3.3 France | | |
      4. 7.3.4 Italy | | |
      5. 7.3.5 Rest of Europe | |
    4. 7.4 South America | | |
      1. 7.4.1 Brazil | | |
      2. 7.4.2 Argentina | | |
      3. 7.4.3 Rest of South America | |
    5. 7.5 Middle-East and Africa | | |
      1. 7.5.1 Saudi Arabia | | |
      2. 7.5.2 South Africa | | |
      3. 7.5.3 Rest of Middle-East and Africa | |
  8. 8 Future Outlook (2026–2035) | |
    1. 8.1 The Move to Non-Food and Waste Feedstocks | |
    2. 8.2 Carbon Accounting and Digital Product Passports | |
    3. 8.3 Continuous Pharmaceutical Manufacturing | |
    4. 8.4 AI-Assisted Formulation and Strain Engineering | |
  9. 9 Segmentation Analysis | |
    1. 9.1 By Type | | |
      1. 9.1.1 Bio-alcohols | | | |
        1. 9.1.1.1 Bio-ethanol | | | |
        2. 9.1.1.2 Bio-methanol | | | |
        3. 9.1.1.3 Bio-propanol | | | |
        4. 9.1.1.4 Bio-butanol | | |
      2. 9.1.2 Bio-glycols | | | |
        1. 9.1.2.1 Bio-based Propylene Glycol | | | |
        2. 9.1.2.2 Bio-based Ethylene Glycol | | |
      3. 9.1.3 Bio-diols | | |
      4. 9.1.4 Ethyl Lactate | | |
      5. 9.1.5 D-Limonene | | |
      6. 9.1.6 Methyl Soyate | | |
      7. 9.1.7 Other Types | |
    2. 9.2 By Application | | |
      1. 9.2.1 Paints and Coatings | | |
      2. 9.2.2 Industrial and Domestic Cleaning | | |
      3. 9.2.3 Printing Inks | | |
      4. 9.2.4 Adhesives and Sealants | | |
      5. 9.2.5 Pharmaceuticals | | |
      6. 9.2.6 Cosmetics and Personal Care | | |
      7. 9.2.7 Agriculture | | |
      8. 9.2.8 Other Applications | |
    3. 9.3 By End-User Industry | | |
      1. 9.3.1 Automotive | | |
      2. 9.3.2 Construction | | |
      3. 9.3.3 Pharmaceutical and Healthcare | | |
      4. 9.3.4 Food and Beverages | | |
      5. 9.3.5 Consumer Goods | | |
      6. 9.3.6 Agriculture | | |
      7. 9.3.7 Electronics | | |
      8. 9.3.8 Others | |
  10. 10 Competitive Landscape | |
    1. 10.1 Market Concentration Analysis | |
    2. 10.2 Competitive Benchmarking Matrix | |
    3. 10.3 Company Profiles | | |
      1. 10.3.1 Dow | | |
      2. 10.3.2 ADM | | |
      3. 10.3.3 BASF | | |
      4. 10.3.4 Solvay | | |
      5. 10.3.5 Cargill, Incorporated | | |
      6. 10.3.6 Corbion | | |
      7. 10.3.7 Vertec BioSolvents Inc. | | |
      8. 10.3.8 Braskem | | |
      9. 10.3.9 Covation Biomaterials | | |
      10. 10.3.10 Gevo | | |
      11. 10.3.11 Galactic | | |
      12. 10.3.12 Florachem Corp. | |
  11. 11 Recent News & Developments | |
  12. 12 Report Scope and Methodology | |
  13. 13 Detailed Sources and Citations | |
  14. 14 Frequently Asked Questions (FAQs) | | LIST OF TABLES | |
  15. TABLE 1 Global Market Size and Forecast, by Revenue (USD Billion), 2021–2035 | |
  16. TABLE 2 Driver Impact Analysis, 2026–2035 | |
  17. TABLE 3 Restraints Impact Analysis, 2026–2035 | |
  18. TABLE 4 Regional Summary, 2025 (USD Billion) | |
  19. TABLE 5 Asia Pacific Market, by Country, 2025 | |
  20. TABLE 6 North America Market, by Country, 2025 | |
  21. TABLE 7 Europe Market, by Country, 2025 | |
  22. TABLE 8 South America Market, by Country, 2025 | |
  23. TABLE 9 Middle-East and Africa Market, by Country, 2025 | |
  24. TABLE 10 Global Market, by Type, 2025 | |
  25. TABLE 11 Global Market, by Application, 2025 | |
  26. TABLE 12 Global Market, by End-User Industry, 2025 | |
  27. TABLE 13 Competitive Benchmarking Matrix, 2025 | |
  28. TABLE 14 Report Scope and Methodology | |
  29. TABLE 15 Detailed Sources and Citations | | LIST OF FIGURES | |
  30. FIGURE 1 Market Dynamics Overview — Drivers, Restraints and Opportunities | |
  31. FIGURE 2 Industry Value Chain Analysis | |
  32. FIGURE 3 Porter's Five Forces Analysis | |
  33. FIGURE 4 Global Market Size Trend, 2021–2035 (USD Billion) | |
  34. FIGURE 5 Market Share, by Type, 2025 (%) | |
  35. FIGURE 6 Market Share, by Application, 2025 (%) | |
  36. FIGURE 7 Market Share, by End-User Industry, 2025 (%) | |
  37. FIGURE 8 Regional Market Share, 2025 (%) | |
  38. FIGURE 9 Country-Level Market Share within Each Region, 2025 (%) | |
  39. FIGURE 10 Competitive Landscape — Estimated Revenue Share Ranges of Key Players, 2025

Segmentation Quick Reference

DimensionSub-SegmentsDominant SegmentFastest Growing Segment
By TypeBio-alcohols; Bio-glycols; Bio-diols; Ethyl Lactate; D-Limonene; Methyl Soyate; Other TypesBio-alcohols (34.6% share)Ethyl Lactate (8.9% CAGR)
By ApplicationPaints and Coatings; Industrial and Domestic Cleaning; Printing Inks; Adhesives and Sealants; Pharmaceuticals; Cosmetics and Personal Care; Agriculture; Other ApplicationsPaints and Coatings (25.9% share)Pharmaceuticals (9.6% CAGR)
By End-User IndustryAutomotive; Construction; Pharmaceutical and Healthcare; Food and Beverages; Consumer Goods; Agriculture; Electronics; OthersConstruction (30.0% share)Pharmaceutical and Healthcare (10.2% CAGR)
By RegionAsia Pacific; North America; Europe; South America; Middle-East and AfricaAsia Pacific (41.2% share)Asia Pacific (8.4% CAGR)

Market Segmentation Overview

By Type

Sub-SegmentKey Trend
Bio-alcoholsBio-ethanol dominates volume; bio-butanol and bio-propanol gain in coatings
Bio-glycolsBio-based propylene glycol and ethylene glycol tied to OEM bio-content targets
Bio-diolsPropanediol platforms move into coatings and personal care
Ethyl LactateHigh-purity grades for electronics and pharmaceutical synthesis
D-LimoneneCitrus-derived cleaners constrained by orange-crop volatility
Methyl SoyateAgricultural adjuvants and low-toxicity inks
Other TypesDeep eutectic and specialty chemistries in pilot use

Bio-alcohols lead the type dimension because bio-ethanol plugs directly into existing coatings, cleaning and ink formulations without reformulation. Ethyl Lactate grows fastest, as its residue-free evaporation suits semiconductor cleaning and its regulatory acceptance supports pharmaceutical and food-contact uses. Bio-glycols sit between the two, gaining from automotive bio-content scorecards, while D-Limonene's growth is capped by citrus supply risk.

By Application

Sub-SegmentKey Trend
Paints and CoatingsVOC limits push water-borne and bio-alcohol systems
Industrial and Domestic CleaningEco-label certification favors d-limonene and bio-ethanol
Printing InksPackaging migration rules replace petro-glycols
Adhesives and SealantsBio-propylene glycol earns low-emission building credits
PharmaceuticalsICH Q3C limits and CDMO audits drive substitution
Cosmetics and Personal CareBio-alcohols as clean-beauty fragrance carriers
AgricultureMethyl soyate improves herbicide penetration
Other ApplicationsTextile, leather and extraction pilots

Paints and Coatings hold the largest application share because architectural and industrial VOC limits apply to enormous volumes of product. Pharmaceuticals expand fastest, driven by residual-solvent limits and client-mandated sustainability audits at CDMOs. Industrial and Domestic Cleaning and Printing Inks provide steady mid-sized demand anchored in eco-label and packaging-migration rules.

By End-User Industry

Sub-SegmentKey Trend
AutomotiveBio-glycol coatings meet in-plant emission ceilings
ConstructionLow-VOC coatings and sealants for green-building credits
Pharmaceutical and HealthcareNet-zero procurement at CDMOs
Food and BeveragesEthyl lactate and d-limonene for extraction and cleaning
Consumer GoodsRetailer scorecards reward high bio-content
AgricultureBiodegradable spray adjuvants
ElectronicsUltra-low-residue precision cleaning
OthersTextile dyeing and leather finishing trials

Construction dominates end-use demand because coatings and sealants specified for certified green buildings consume large solvent volumes. Pharmaceutical and Healthcare grows fastest as CDMOs translate client net-zero targets into solvent procurement criteria. Electronics, though smaller, is the next growth engine, with manufacturers replacing NMP in precision cleaning steps.

=

Download PDF ×

We do not share your information with anyone. However, we may send you emails based on your report interest from time to time. You may contact us at any time to opt-out.