Certified Global Research Member


Key Questions Answered
- Global Market Outlook
- In-depth analysis of global and regional trends
- Analyze and identify the major players in the market, their market share, key developments, etc.
- To understand the capability of the major players based on products offered, financials, and strategies.
- Identify disrupting products, companies, and trends.
- To identify opportunities in the market.
- Analyze the key challenges in the market.
- Analyze the regional penetration of players, products, and services in the market.
- Comparison of major players’ financial performance.
- Evaluate strategies adopted by major players.
- Recommendations
Why Choose Market Research Future?
- Vigorous research methodologies for specific market.
- Knowledge partners across the globe
- Large network of partner consultants.
- Ever-increasing/ Escalating data base with quarterly monitoring of various markets
- Trusted by fortune 500 companies/startups/ universities/organizations
- Large database of 5000+ markets reports.
- Effective and prompt pre- and post-sales support.
Market Size Snapshot
| Year | Value |
|---|---|
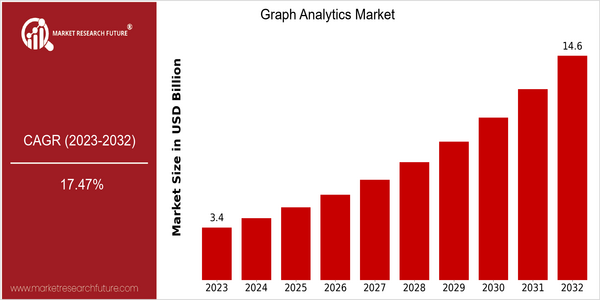
| 2023 | USD 3.43 Billion |
| 2032 | USD 14.6 Billion |
| CAGR (2024-2032) | 17.47 % |
Note – Market size depicts the revenue generated over the financial year
The Graph Analytics Market is estimated to be worth $3.43 billion in 2023 and is expected to reach $14.6 billion by 2032, at a CAGR of 18.56% from 2024 to 2032. This is mainly due to the need for advanced data analysis and visualization tools, which can effectively handle complex data and large data sets. There are several factors that are driving the graph analytics market, including the increasing use of big data, the growing demand for real-time data processing, and the increasing complexity of data relationships in the business environment. Artificial intelligence and machine learning are also enhancing the graph analytic capabilities of the tools, enabling them to derive more insights from the data and make better decisions. The leading players in the market, including Neo4j, Tigergraph, and Amazon Web Services, are actively investing in innovation and forming strategic partnerships to expand their offerings and capture a larger market share. Recent developments in the market, such as the launch of new products and the establishment of strategic alliances to integrate graph analytics with other data management solutions, have also shown the dynamic nature of the graph analytics market.
Regional Market Size
Regional Deep Dive
Graph analytics is experiencing a significant growth across various regions, driven by the growing need for advanced data visualization and analysis tools. North America has a high enterprise adoption of graph analytics solutions. The presence of large IT companies and a vibrant start-up culture is boosting the market. Europe has a high regulatory compliance and data privacy focus, which is driving the development of graph analytics tools that are in compliance with the GDPR and other regulations. Asia-Pacific is experiencing a rapid digital transformation, which is boosting the demand for graph analytics in the finance and telecommunications industries. The Middle East and Africa is gradually embracing graph analytics, as the region is making significant investments in IT and data-driven decision-making. Latin America is emerging as a potential market, driven by the growing internet penetration and the need for advanced data visualization and analysis tools in various industries.
Europe
- Moreover, the European market is experiencing an upsurge in graph-based solutions, driven by the looming arrival of the General Data Protection Regulation (GDPR), which is expected to have a major impact on the use of data and the need for more sophisticated data management solutions. The emergence of new companies like GraphAware is therefore very timely.
- Innovations in graph-based machine learning are gaining traction in Europe, with organizations like Siemens and Bosch investing in research and development to enhance their analytics capabilities, particularly in manufacturing and IoT applications.
Asia Pacific
- The Asia-Pacific region is undergoing a digital transformation, with China and India being the leaders in graph analytics for various applications such as fraud detection and social network analysis. The leading players in this space are Alibaba and Tata Consultancy Services.
- Government initiatives aimed at promoting smart cities and digital economies are driving investments in graph analytics solutions, as local governments seek to leverage data for improved urban planning and public services.
Latin America
- Latin America is experiencing a growing penetration of the Internet, and digital transformation. As a result, graph analytics is becoming more important for companies wishing to turn data into a strategic asset. Companies such as Totvs in Brazil are developing solutions that are appropriate for local markets.
- The region's unique cultural and economic factors, such as a diverse consumer base and varying levels of technological adoption, are influencing the development of graph analytics tools that cater to specific industry needs.
North America
- The development of artificial intelligence and machine learning in North America has led to a demand for graph data, and organizations have been looking for ways to increase their data-processing abilities. Tigergraph and Neo4j are at the forefront of this trend with their new products, which combine artificial intelligence with graph data.
- Changes in the legal framework, especially in the field of data protection and security, are forcing companies to use graph analysis for better risk management and compliance. The Californian Data Protection Act is one example of a regulation that is having an impact on the market.
Middle East And Africa
- In the Middle East, the importance of data-driven decision-making is increasingly recognized. This is particularly true in the oil and gas industry, where companies are increasingly using graph analytics to optimize operations and enhance predictive maintenance. Among those exploring these new possibilities is Saudi Aramco.
- The African market is gradually recognizing the potential of graph analytics, with startups and tech hubs emerging in countries like Kenya and Nigeria, focusing on data analytics solutions that cater to local business needs.
Did You Know?
“Did you know that graph analytics can process complex relationships and connections in data up to 100 times faster than traditional relational databases?” — Gartner Research
Segmental Market Size
GR: Graph. Big data is a booming trend in the IT industry, which requires the use of powerful tools to analyse the data and uncover hidden patterns. Moreover, the increasing use of data-driven decision-making in all industries is expected to drive the demand for advanced analytics. Regulations that encourage transparency and data governance will also boost the adoption of graph analytics solutions. Currently, the market is at a stage of scaled deployment, with notable leaders such as Neo4j and Amazon Web Services having already implemented graph databases in various industries. Fraud detection in finance, network security in telecommunications and recommendation systems in e-commerce are just a few of the examples of use cases. Growth is also being accelerated by the shift towards artificial intelligence and machine learning. Graph-based solutions, machine learning algorithms and visualisation tools are driving the market and enabling organisations to gain strategic advantages from the interconnectedness of their data.
Future Outlook
From 2023 to 2032, the Graph Analytics Market is expected to grow at a strong CAGR of 17.47%. This growth will be driven by the increasing complexity of data and the need for advanced analytical capabilities to derive actionable insights. In the coming years, the use of graph analytics will increase as more and more organizations from different industries, such as finance, healthcare and telecommunications, realize the value of graph analytics in identifying and analyzing relationships and patterns in large amounts of data. Enterprises are expected to use graph analytics in more than one-third of their data strategies by 2032, compared to only one-tenth in 2023, which will lead to a significant shift in data-driven decision-making. Moreover, technological advancements, such as the integration of artificial intelligence (AI) and machine learning (ML) with graph analytics, are expected to further drive the growth of the market. These technologies will enable enterprises to model and predict more complex data and trends, which will help them optimize their operations. Also, the growing demand for real-time data analysis and the need for stronger cyber-security will lead to increased demand for graph-based solutions. Meanwhile, the emergence of graph-based databases and the growing popularity of cloud-based graph-based platforms will make graph-based solutions more accessible and scalable to organizations of all sizes.
Covered Aspects:| Report Attribute/Metric | Details |
|---|---|
| Growth Rate | 31.6% (2019-2025) |
Graph Analytics Market Highlights:
Leading companies partner with us for data-driven Insights
Kindly complete the form below to receive a free sample of this Report
Tailored for You
- Dedicated Research on any specifics segment or region.
- Focused Research on specific players in the market.
- Custom Report based only on your requirements.
- Flexibility to add or subtract any chapter in the study.
- Historic data from 2014 and forecasts outlook till 2040.
- Flexibility of providing data/insights in formats (PDF, PPT, Excel).
- Provide cross segmentation in applicable scenario/markets.