Germany Germany Malware Protection Market Segmentation
Germany Malware Protection Market By Component (USD Million, 2025-2035)
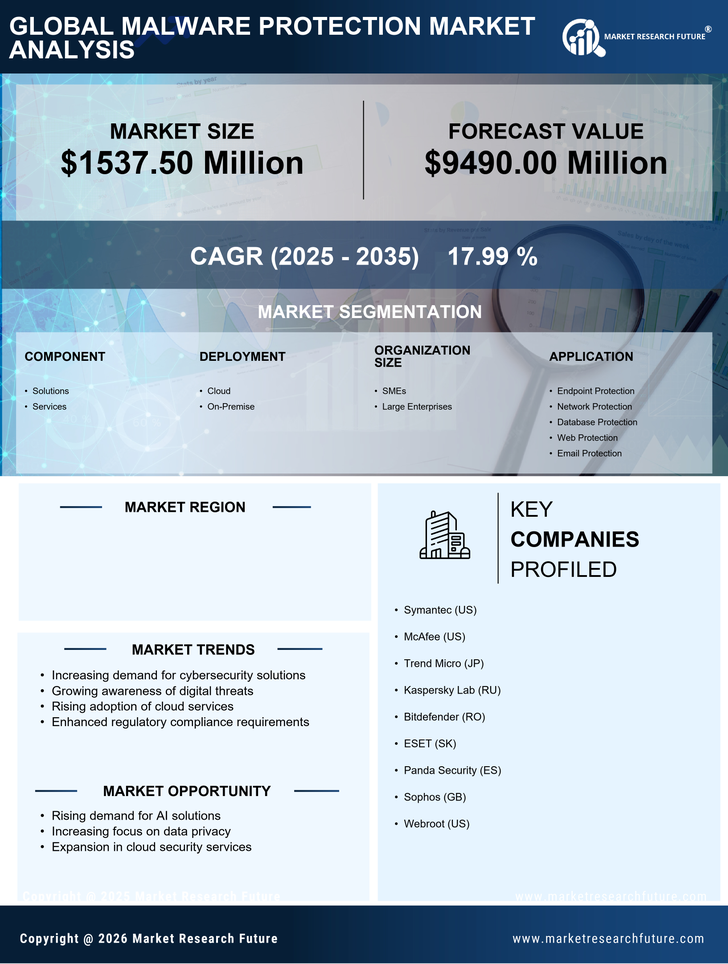
- Solutions
- Services
Germany Malware Protection Market By Deployment (USD Million, 2025-2035)
- Cloud
- On-Premise
Germany Malware Protection Market By Organization Size (USD Million, 2025-2035)
- SMEs
- Large Enterprises
Germany Malware Protection Market By Application (USD Million, 2025-2035)
- Endpoint Protection
- Network Protection
- Database Protection
- Web Protection
- Email Protection
Germany Malware Protection Market By Industry Vertical (USD Million, 2025-2035)
- BFSI
- IT & Telecom
- Government & Defense
- Retail
- Education
- Healthcare & Life Sciences
- Others