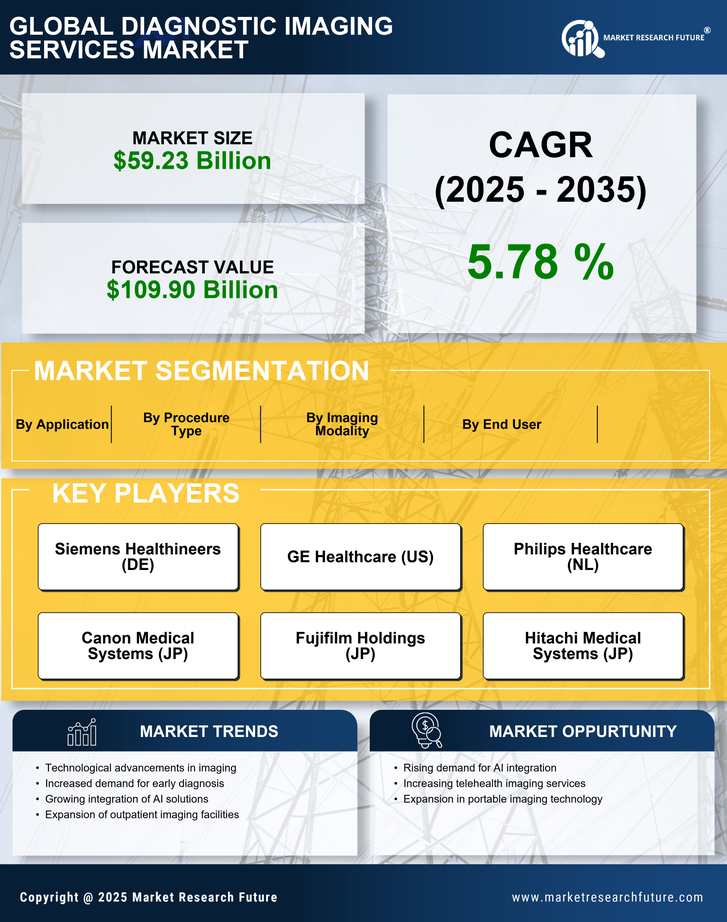
Germany Diagnostic Imaging Services Market Segmentation
Germany Diagnostic Imaging Services Market By Procedure Type (USD Billion, 2025-2035)
- X-ray
- Ultrasound
- Magnetic Resonance Imaging
- Computed Tomography
- Nuclear Medicine
Germany Diagnostic Imaging Services Market By End User (USD Billion, 2025-2035)
- Hospitals
- Diagnostic Centers
- Outpatient Imaging Centers
- Research Laboratories
Germany Diagnostic Imaging Services Market By Imaging Modality (USD Billion, 2025-2035)
- Analog Imaging
- Digital Imaging
- Hybrid Imaging
Germany Diagnostic Imaging Services Market By Application (USD Billion, 2025-2035)
- Cardiology
- Oncology
- Neurology
- Orthopedics