Garbage Collection Vehicle Market (2026 - 2035)

ID: MRFR/AT/6467-HCR 100 Pages Shubham Munde Last Updated: October 31, 2026
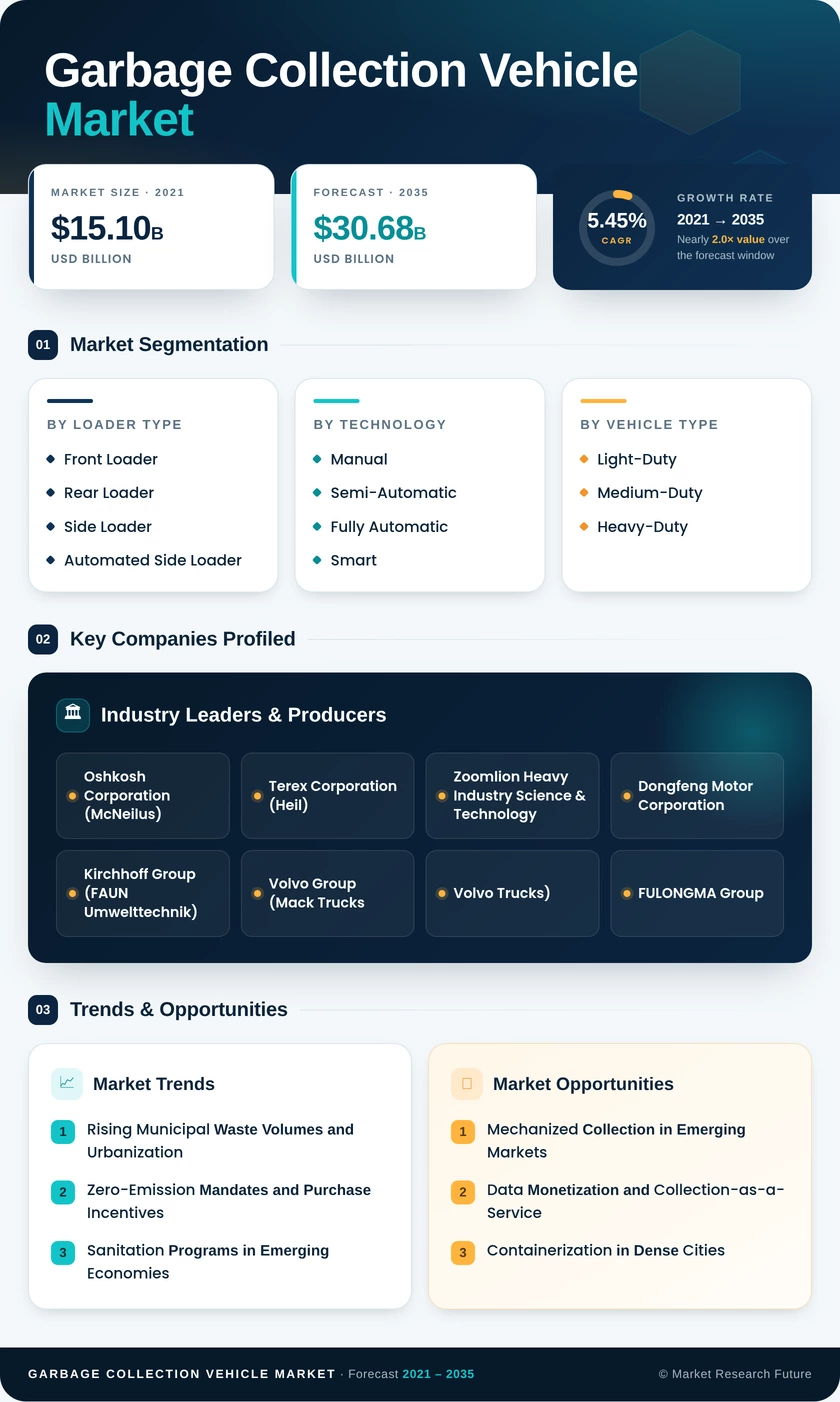
Garbage Collection Vehicle Market Research Report By Loader Type (Front Loader, Rear Loader, Side Loader, Automated Side Loader), By Technology (Manual, Semi-Automatic, Fully Automatic, Smart), By Vehicle Type (Light-Duty, Medium-Duty, Heavy-Duty), By Propulsion Type (ICE, Electric, Hybrid, CNG), By Application (Municipal, Commercial, Industrial) - Forecast to 2035
Garbage Collection Vehicle Market
Market Size
Forecast Period2026-2035
CAGR (2026-2035)5.45%
2025 Market SizeUSD 18.05 Billion
2035 Market SizeUSD 30.68 Billion
Key Players
Oshkosh Corporation
Terex Corporation
Zoomlion Heavy Industry Science & Technology
Dongfeng Motor Corporation
Kirchhoff Group
Volvo Group (Mack Trucks
Opportunities
  • Mechanized Collection in Emerging Markets
  • Data Monetization and Collection-as-a-Service
  • Containerization in Dense Cities
  1. 1 Market Summary | |
  2. 2 Key Report Takeaways | |
    1. 2.1 By Loader Type | |
    2. 2.2 By Technology | |
    3. 2.3 By Vehicle Type | |
    4. 2.4 By Propulsion Type | |
    5. 2.5 By Application | |
    6. 2.6 By Region | |
  3. 3 Market Size and Forecast (2021–2035) | |
    1. 3.1 Historical Market Size (2021–2025) | |
    2. 3.2 Forecast Market Size (2026–2035) | |
    3. 3.3 Year-over-Year Growth Analysis | |
  4. 4 Driver Impact Analysis | |
    1. 4.1 Rising Municipal Waste Volumes and Urbanization | |
    2. 4.2 Zero-Emission Mandates and Purchase Incentives | |
    3. 4.3 Sanitation Programs in Emerging Economies | |
    4. 4.4 Labor Scarcity and Collector Safety | |
    5. 4.5 Fleet Replacement Cycles and Route Optimization | |
    6. 4.6 Recycling and Separate-Collection Mandates | |
  5. 5 Restraints Impact Analysis | |
    1. 5.1 High Upfront Cost of Electric Units | |
    2. 5.2 Charging Infrastructure and Grid Capacity | |
    3. 5.3 Municipal Budget Pressure and Long Procurement Cycles | |
    4. 5.4 Policy Reversals in the United States | |
    5. 5.5 Cybersecurity Concerns in Connected Fleets | |
  6. 6 Opportunities | |
    1. 6.1 Mechanized Collection in Emerging Markets | |
    2. 6.2 Data Monetization and Collection-as-a-Service | |
    3. 6.3 Containerization in Dense Cities | |
    4. 6.4 Battery Leasing and Swap Models | |
    5. 6.5 Repower and Retrofit Programs | |
  7. 7 Regional Market Share and Country-Level Analysis | |
    1. 7.1 North America | | |
      1. 7.1.1 US | | |
      2. 7.1.2 Canada | | |
      3. 7.1.3 Mexico | |
    2. 7.2 Europe | | |
      1. 7.2.1 Germany | | |
      2. 7.2.2 UK | | |
      3. 7.2.3 France | | |
      4. 7.2.4 Italy | | |
      5. 7.2.5 Spain | | |
      6. 7.2.6 Nordic Countries | | |
      7. 7.2.7 Russia | | |
      8. 7.2.8 Rest of Europe | |
    3. 7.3 Asia-Pacific | | |
      1. 7.3.1 China | | |
      2. 7.3.2 India | | |
      3. 7.3.3 Japan | | |
      4. 7.3.4 South Korea | | |
      5. 7.3.5 ASEAN | | |
      6. 7.3.6 Rest of Asia-Pacific | |
    4. 7.4 South America | | |
      1. 7.4.1 Brazil | | |
      2. 7.4.2 Argentina | | |
      3. 7.4.3 Rest of South America | |
    5. 7.5 Middle East & Africa | | |
      1. 7.5.1 Saudi Arabia | | |
      2. 7.5.2 UAE | | |
      3. 7.5.3 South Africa | | |
      4. 7.5.4 Egypt | | |
      5. 7.5.5 Rest of MEA | |
  8. 8 Future Outlook (2026–2035) | |
    1. 8.1 AI-Guided Collection and Autonomy | |
    2. 8.2 Electrification Supercycle | |
    3. 8.3 Circular Economy and ESG Reporting | |
    4. 8.4 Lifecycle and Service-Based Procurement | |
  9. 9 Segmentation Analysis | |
    1. 9.1 By Loader Type | | |
      1. 9.1.1 Front Loader | | |
      2. 9.1.2 Rear Loader | | |
      3. 9.1.3 Side Loader | | |
      4. 9.1.4 Automated Side Loader | |
    2. 9.2 By Technology | | |
      1. 9.2.1 Manual | | |
      2. 9.2.2 Semi-Automatic | | |
      3. 9.2.3 Fully Automatic | | |
      4. 9.2.4 Smart | |
    3. 9.3 By Vehicle Type | | |
      1. 9.3.1 Light-Duty | | |
      2. 9.3.2 Medium-Duty | | |
      3. 9.3.3 Heavy-Duty | |
    4. 9.4 By Propulsion Type | | |
      1. 9.4.1 ICE | | |
      2. 9.4.2 Electric | | |
      3. 9.4.3 Hybrid | | |
      4. 9.4.4 CNG | |
    5. 9.5 By Application | | |
      1. 9.5.1 Municipal | | |
      2. 9.5.2 Commercial | | |
      3. 9.5.3 Industrial | |
  10. 10 Competitive Landscape | |
    1. 10.1 Market Concentration Analysis | |
    2. 10.2 Competitive Benchmarking Matrix | |
    3. 10.3 Company Profiles | | |
      1. 10.3.1 Oshkosh Corporation (McNeilus) | | |
      2. 10.3.2 Terex Corporation (Heil) | | |
      3. 10.3.3 Zoomlion Heavy Industry Science & Technology | | |
      4. 10.3.4 Dongfeng Motor Corporation | | |
      5. 10.3.5 Kirchhoff Group (FAUN Umwelttechnik) | | |
      6. 10.3.6 Volvo Group (Mack Trucks, Volvo Trucks) | | |
      7. 10.3.7 FULONGMA Group | | |
      8. 10.3.8 Dennis Eagle | | |
      9. 10.3.9 Daimler Truck (Mercedes-Benz, Freightliner) | | |
      10. 10.3.10 Labrie Enviroquip Group | | |
      11. 10.3.11 BYD Company | | |
      12. 10.3.12 New Way Trucks (Scranton Manufacturing) | |
  11. 11 Recent News & Developments | |
  12. 12 Report Scope and Methodology | |
  13. 13 Detailed Sources and Citations | |
  14. 14 Frequently Asked Questions (FAQs) | | LIST OF TABLES | |
  15. TABLE 1 Report Snapshot – Key Market Metrics | |
  16. TABLE 2 Global Market Size & Forecast, by Revenue (USD Billion), 2021–2035 | |
  17. TABLE 3 Driver Impact Analysis on CAGR, 2026–2035 | |
  18. TABLE 4 Restraint Impact Analysis on CAGR, 2026–2035 | |
  19. TABLE 5 Regional Market Summary, 2025 | |
  20. TABLE 6 North America Market, by Country | |
  21. TABLE 7 Europe Market, by Country | |
  22. TABLE 8 Asia-Pacific Market, by Country | |
  23. TABLE 9 South America Market, by Country | |
  24. TABLE 10 Middle East & Africa Market, by Country | |
  25. TABLE 11 Global Market, by Loader Type | |
  26. TABLE 12 Global Market, by Technology | |
  27. TABLE 13 Global Market, by Vehicle Type | |
  28. TABLE 14 Global Market, by Propulsion Type | |
  29. TABLE 15 Global Market, by Application | |
  30. TABLE 16 Competitive Benchmarking Matrix | |
  31. TABLE 17 Report Scope and Methodology | |
  32. TABLE 18 Detailed Sources and Citations | |
  33. TABLE 19 Segmentation Quick Reference | | LIST OF FIGURES | |
  34. FIGURE 1 Market Dynamics Overview – Drivers, Restraints and Opportunities | |
  35. FIGURE 2 Industry Value Chain Analysis | |
  36. FIGURE 3 Porter's Five Forces Analysis | |
  37. FIGURE 4 Global Market Size Trend, 2021–2035 (USD Billion) | |
  38. FIGURE 5 Year-over-Year Growth Rate, 2021–2035 | |
  39. FIGURE 6 Market Share, by Loader Type, 2025 | |
  40. FIGURE 7 Market Share, by Technology, 2025 | |
  41. FIGURE 8 Market Share, by Vehicle Type, 2025 | |
  42. FIGURE 9 Market Share, by Propulsion Type, 2025 | |
  43. FIGURE 10 Market Share, by Application, 2025 | |
  44. FIGURE 11 Regional Market Share, 2025 | |
  45. FIGURE 12 Regional CAGR Comparison, 2026–2035 | |
  46. FIGURE 13 Country-Level Share within Each Region, 2025 | |
  47. FIGURE 14 Competitive Landscape – Estimated Revenue Share Ranges | |
  48. FIGURE 15 Competitive Positioning Matrix

Segmentation Quick Reference

DimensionSub-SegmentsDominant SegmentFastest Growing Segment
By Loader TypeFront Loader, Rear Loader, Side Loader, Automated Side LoaderRear Loader (49.0% share)Automated Side Loader (5.49% CAGR)
By TechnologyManual, Semi-Automatic, Fully Automatic, SmartManual (60.5% share)Semi-Automatic (5.58% CAGR)
By Vehicle TypeLight-Duty, Medium-Duty, Heavy-DutyMedium-Duty (45.3% share)Medium-Duty (45.3% share)
By Propulsion TypeICE, Electric, Hybrid, CNGICE (78.6% share)Electric (5.50% CAGR)
By ApplicationMunicipal, Commercial, IndustrialMunicipal (71.0% share)Commercial (5.6% CAGR)
By RegionNorth America, Europe, Asia-Pacific, South America, Middle East & AfricaAsia-Pacific — 38.4% share (2025)Middle East & Africa — 6.9% CAGR (2026–2035)


Download PDF ×

We do not share your information with anyone. However, we may send you emails based on your report interest from time to time. You may contact us at any time to opt-out.