Segmentation Quick Reference
| Dimension | Sub-Segments | Dominant Segment | Fastest Growing Segment |
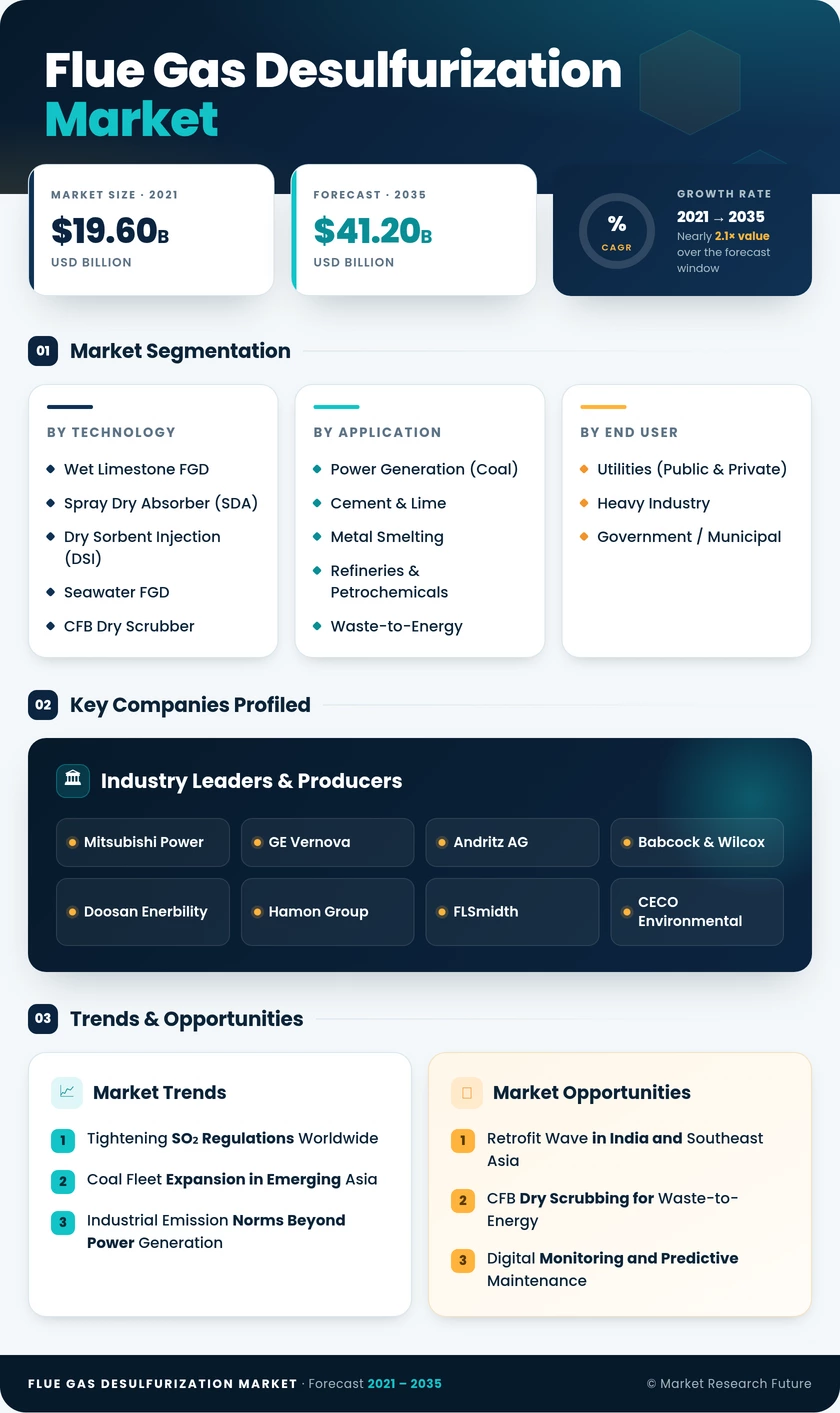
| By Technology | Wet Limestone FGD; Spray Dry Absorber (SDA); Dry Sorbent Injection (DSI); Seawater FGD; CFB Dry Scrubber | Wet Limestone FGD (58% share) | Spray Dry Absorber — CAGR 6.8% |
| By Application | Power Generation (Coal); Cement & Lime; Metal Smelting; Refineries & Petrochemicals; Waste-to-Energy | Power Generation (64% share) | Waste-to-Energy — CAGR 7.1% |
| By End User | Utilities (Public & Private); Heavy Industry; Government / Municipal | Utilities (68% share) | Heavy Industry — CAGR 6.2% |
Market Segmentation Overview
By Technology
| Sub-Segment | Key Trend |
| Wet Limestone FGD | Upgrade cycle: forced-oxidation gypsum variants replacing simple limestone slurry |
| Spray Dry Absorber (SDA) | Gaining share in sub-300 MW boilers and waste-to-energy plants |
| Dry Sorbent Injection (DSI) | Rapid retrofit solution for facilities with limited shutdown windows |
| Seawater FGD | Expanding in coastal refineries in the Middle East and Southeast Asia |
| CFB Dry Scrubber | Preferred for variable-fuel applications including biomass co-firing |
The technology landscape of the Flue Gas Desulfurization Market is bifurcating: large utility-scale plants continue to rely on wet limestone FGD scrubber systems for maximum SO₂ removal, while mid-size and industrial applications increasingly adopt spray dry absorber SDA FGD systems and dry sorbent injection DSI FGD for their lower water use, smaller footprint, and faster installation timelines.
By Application
| Sub-Segment | Key Trend |
| Power Generation (Coal) | Still the largest application; regulatory mandates in Asia driving new installs |
| Cement & Lime | EU MCPD and U.S. NESHAP extending FGD requirements to kiln operations |
| Metal Smelting | Copper and zinc smelter compliance in Chile, China, and Zambia |
| Refineries & Petrochemicals | FCC unit and sulfur-recovery tail-gas treatment driving demand |
| Waste-to-Energy | Fastest-growing application; SDA and CFB dry FGD are preferred technologies |
Non-power applications are gaining prominence as regulators extend emission standards to industrial sectors previously exempt from SO₂ controls. Cement kilns, metal smelters, and waste-to-energy plants collectively represent a growing share of the addressable Flue Gas Desulfurization Market.
By End User
| Sub-Segment | Key Trend |
| Utilities (Public & Private) | Dominant buyer; transitioning from new-build to retrofit and life-extension |
| Heavy Industry | Rising regulatory pressure on cement, steel, and non-ferrous metals |
| Government / Municipal | Growing WtE and district-heating FGD mandates in Europe and East Asia |
Utilities continue to anchor the demand side, but heavy industry's share is rising as environmental enforcement broadens. Government and municipal entities are an emerging buyer segment, particularly for waste-to-energy FGD systems in cities pursuing zero-landfill targets.