×
  • Cat-intel
  • MedIntelliX
  • Resources
  • About Us
  • Hero Background
    English
    Chinese
    French
    Japanese
    Korean
    German
    Spanish

    Flavoured Syrups Market Size

    ID: MRFR/F-B & N/2940-HCR
    110 Pages
    Tejas Chaudhary
    October 2025

    Flavoured Syrups Market Research Report Information By Flavor type (Fruits, Coffee, Chocolate, Vanilla, Mint, Nuts, Caramel and Blends), By Category (Conventional and Organic), By Distribution Channel (Food Service and Food Retail), And By Region (North America, Europe, Asia-Pacific, And Rest Of The World) –Market Forecast Till 2035

    Share:
    Download PDF ×

    We do not share your information with anyone. However, we may send you emails based on your report interest from time to time. You may contact us at any time to opt-out.

    Flavoured Syrups Market Infographic
    Purchase Options

    Flavoured Syrups Size

    Flavoured Syrups Market Growth Projections and Opportunities

    The size of the market for flavored syrups is influenced by various factors, which in totality affect its growth and dynamics. For instance, an increasing number of people requiring custom-made drinks with special flavors are one of the major drivers behind the escalating demand for flavored syrups. Flavored syrups have evolved as an adaptable ingredient to improve taste profiles in different beverages such as coffee, tea, cocktails and soda as individuals seek to indulge in unique flavor experiences.”

    By 2032 the Flavored Syrups Market is expected to achieve a CAGR of 5.1% reaching a value upto USD 54.92 billion. This can be accounted for in terms of enhancing meal flavor which has made businesses earn higher revenues from it. In this forecast period, this projection underlines the economic importance of the market and its sustained expansion.

    Switched diet habits and awareness about health also affect the flavoured syrups market. Healthier and natural alternatives are increasingly demanded by consumers as they become more mindful of their sugar consumption and overall well-being. As such, health conscious consumers can find sugar-free versions as well as naturally-sweetened options among flavoured syrups introduced by industry players that endeavor not only to maintain a favorable taste profile but also respond to these changing trends.

    Flavoured syrup markets are driven largely by food service sector activity. The use if flavored syrup in cafes restaurants and bars help create signature drinks which improve dining experience generally perceived by customers within these establishments. Speciality coffee shops’ popularity alongside mixology within beverages further contributes towards diversification into many kinds of flavored syrup hence opening up pull factors for market expansion.

    Additionally, seasonal tastes together with regional preferences influence how flavoured syrup markets perform. Cultural or culinary-based preferences determine popularity levels of some flavors during specific times or/and regions around the world hence making makers usually adapt their product formulations so as to meet their demands and be competitive and relevant to a wider audience.

    The flavoured syrup markets are also affected by government regulations while labelling requirements also play a role. It is imperative for companies seeking to gain the confidence of consumers that they comply with food safety guidelines, reveal information about ingredients used, and offer nutritional labeling. Market participants who adhere proactively to these standards may establish brand equity favorable toward them thus positioning themselves well amongst rivals.

    Supermarkets, convenience stores, online platforms among others form part of distribution channels which ensure accessibility and availability of flavored syrups. Product visibility through efficient distribution networks combined with strategic alliances with retailers ensures easy access for customers to their preferred flavors available.
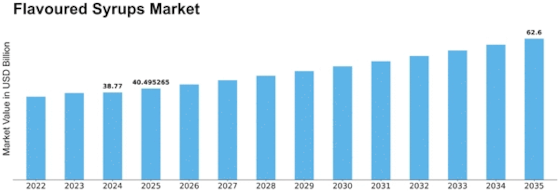
    Flavoured Syrups Market Size Graph
    Author
    Tejas Chaudhary
    Research Analyst Level II

    I have a degree in Engineering (Civil), with masters in Business Administration (Marketing). With more than 4 years of experience in market research and consulting, I am involved in end-to-end process of market research, proposals, project kickoffs and delivery. I have research knowledge and expertise in consumer goods/packaging domain. Also I have worked for various other domains like construction & equipment. Effectively managed and delivered more than 60 report studies for regional as well as global clientele.

    Leave a Comment

    FAQs

    How much is the Flavoured Syrups market?

    The Flavoured Syrups market size was valued at USD 36.89 Billion in 2023.

    What is the growth rate of the Flavoured Syrups market?

    The market is projected to grow at a CAGR of 4.45% during the forecast period, 2024-2032.

    Which region held the largest market share in the Flavoured Syrups market?

    Asia Pacific had the largest share in the market

    Who are the key players in the Flavoured Syrups market?

    The key players in the market are The J.M. Smucker Company (US), Wholesome Sweeteners Inc. (US), Conagra Brands, Inc. (US), VKL Seasoning Pvt. Ltd. (India), Nestlé S.A. (Switzerland).

    Which flavor type led the Flavoured Syrups market?

    The fruit category dominated the market in 2023.

    Which distribution channel had the largest market share in the Flavoured Syrups market?

    The fruit retail had the largest share in the market.

    Market Summary

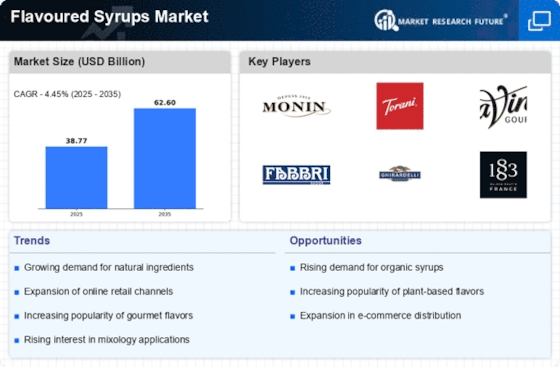
    As per MRFR analysis, the Flavoured Syrups Market Size was estimated at 38.77 USD Billion in 2024. The Flavoured Syrups industry is projected to grow from 40.5 in 2025 to 62.6 by 2035, exhibiting a compound annual growth rate (CAGR) of 4.45 during the forecast period 2025 - 2035.

    Key Market Trends & Highlights

    The Flavoured Syrups Market is experiencing dynamic growth driven by evolving consumer preferences and innovative product offerings.

    • The market is witnessing an emergence of unique flavors that cater to diverse consumer tastes.
    • Health-conscious formulations are gaining traction, reflecting a shift towards more natural and organic ingredients.
    • North America remains the largest market, while Asia-Pacific is recognized as the fastest-growing region in the flavoured syrups sector.
    • Rising demand for specialty beverages and an increased focus on natural ingredients are key drivers propelling market expansion.

    Market Size & Forecast

    2024 Market Size 38.77 (USD Billion)
    2035 Market Size 62.6 (USD Billion)
    CAGR (2025 - 2035) 4.45%
    Largest Regional Market Share in 2024 Asia Pacific

    Major Players

    <p>Monin (FR), Torani (US), Da Vinci Gourmet (US), Fabbri 1905 (IT), Ghirardelli (US), Routin 1883 (FR), Sweetbird (GB), Jordan's Skinny Syrups (US), Finlandia (FI)</p>

    Market Trends

    The Flavoured Syrups Market is currently experiencing a dynamic evolution, driven by changing consumer preferences and an increasing demand for diverse flavor profiles. As consumers become more adventurous in their culinary choices, the market is witnessing a surge in the popularity of unique and exotic flavors. This trend is not only evident in beverages but also in various culinary applications, including desserts and savory dishes. Additionally, the rise of artisanal and craft brands is contributing to a more personalized approach to flavor, appealing to consumers seeking authenticity and quality in their food and drink choices. Moreover, the Flavoured Syrups Market is influenced by a growing awareness of health and wellness. Consumers are increasingly seeking products that align with their dietary preferences, such as organic, natural, and low-calorie options. This shift is prompting manufacturers to innovate and reformulate their offerings to meet these demands. The integration of sustainable practices in production and packaging is also becoming a focal point, as environmentally conscious consumers prioritize brands that demonstrate a commitment to sustainability. Overall, the Flavoured Syrups Market appears poised for continued growth, driven by a blend of creativity, health consciousness, and sustainability.

    Emergence of Unique Flavors

    The Flavoured Syrups Market is witnessing a notable trend towards the introduction of unconventional and exotic flavors. This shift reflects a growing consumer desire for novel taste experiences, leading brands to experiment with ingredients that were previously underutilized. As a result, products featuring flavors such as lavender, hibiscus, and even savory options are gaining traction, appealing to adventurous palates.

    Health-Conscious Formulations

    In response to the increasing focus on health and wellness, the Flavoured Syrups Market is adapting by offering formulations that cater to health-conscious consumers. This includes the development of organic, low-sugar, and natural ingredient options. Brands are likely to prioritize transparency in labeling, allowing consumers to make informed choices about the products they consume.

    Sustainability Initiatives

    Sustainability is becoming a critical consideration within the Flavoured Syrups Market. Companies are increasingly adopting eco-friendly practices in sourcing, production, and packaging. This trend reflects a broader societal shift towards environmental responsibility, as consumers are more inclined to support brands that demonstrate a commitment to sustainable practices.

    Flavoured Syrups Market Market Drivers

    Emergence of E-commerce Platforms

    The Flavoured Syrups Market is experiencing a transformation due to the emergence of e-commerce platforms, which provide consumers with greater access to a diverse range of flavored syrup products. Online shopping has become increasingly popular, allowing consumers to explore and purchase syrups from the comfort of their homes. Recent data indicates that e-commerce sales in the food and beverage sector are projected to grow by 20% over the next few years. This trend presents opportunities for syrup manufacturers to reach a broader audience and engage with consumers through targeted online marketing strategies. Additionally, e-commerce platforms enable brands to showcase their unique offerings and customer reviews, which can influence purchasing decisions and foster brand loyalty in the Flavoured Syrups Market.

    Growth of the Food Service Sector

    The Flavoured Syrups Market is significantly influenced by the expansion of the food service sector, which encompasses restaurants, cafes, and bars. As dining out becomes increasingly popular, establishments are incorporating flavored syrups into their menus to enhance beverages and desserts. Recent statistics indicate that the food service industry is expected to grow by 5% annually, creating a robust demand for flavored syrups. This growth presents opportunities for syrup manufacturers to collaborate with food service providers, offering tailored solutions that meet specific menu needs. Additionally, the trend towards experiential dining encourages establishments to innovate with unique flavor combinations, further driving the demand for diverse syrup options in the Flavoured Syrups Market.

    Rising Demand for Specialty Beverages

    The Flavoured Syrups Market is experiencing a notable surge in demand for specialty beverages, which include craft cocktails, gourmet coffees, and artisanal sodas. This trend is driven by consumers' increasing preference for unique and high-quality drink experiences. According to recent data, the specialty beverage segment is projected to grow at a compound annual growth rate of approximately 8% over the next five years. As consumers seek out innovative flavors and premium ingredients, manufacturers in the Flavoured Syrups Market are responding by expanding their product lines to include exotic and seasonal flavors. This diversification not only caters to evolving consumer tastes but also enhances brand loyalty, as customers are more likely to return for distinctive offerings that cannot be found in standard products.

    Increased Focus on Natural Ingredients

    The Flavoured Syrups Market is witnessing a shift towards natural ingredients as consumers become more health-conscious and ingredient-savvy. This trend is reflected in the rising demand for syrups made from organic fruits, herbs, and spices, which are perceived as healthier alternatives to artificial flavorings. Market Research Future suggests that products labeled as 'natural' or 'organic' are experiencing a sales increase of approximately 15% annually. As a result, manufacturers are reformulating their products to eliminate artificial additives and sweeteners, aligning with consumer preferences for clean-label products. This focus on natural ingredients not only enhances the appeal of flavored syrups but also positions brands favorably in a competitive market, as consumers increasingly seek transparency in their food choices.

    Adoption of Innovative Packaging Solutions

    The Flavoured Syrups Market is also being shaped by the adoption of innovative packaging solutions that enhance product visibility and convenience. As consumers become more environmentally conscious, brands are exploring sustainable packaging options, such as biodegradable materials and refillable containers. This shift is likely to resonate with eco-minded consumers, potentially increasing brand loyalty and market share. Furthermore, advancements in packaging technology allow for better preservation of flavor and freshness, which is crucial for maintaining product quality. The introduction of user-friendly designs, such as pump dispensers and single-serve packets, caters to the on-the-go lifestyle of modern consumers, thereby expanding the market reach of flavored syrups in various settings, including homes and food service establishments.

    Market Segment Insights

    By Flavor Type: Fruit (Largest) vs. Coffee (Fastest-Growing)

    <p>In the Flavoured Syrups Market, the flavor type segment showcases a diverse array of options, with fruits leading the market due to their natural appeal and versatility in various applications. This segment captures considerable consumer attention and enjoys high demand in beverages, desserts, and culinary enhancements. Following closely, coffee as a flavor type has emerged as a favorite among consumers, particularly within specialty coffee drinks, showcasing its growth potential across different sectors.</p>

    <p>Fruit: Dominant vs. Coffee: Emerging</p>

    <p>Fruits serve as the dominant flavor type within the flavoured syrups market, valued for their refreshing taste and wide range of applications, from cocktails to ice creams. Their consumer appeal is enhanced by health and wellness trends favoring natural ingredients. In contrast, coffee, as an emerging flavor, reflects a growing trend towards gourmet beverages and artisanal coffee experiences. With the rise of coffee culture, brands are innovating to incorporate unique coffee flavor syrups, capturing the increasingly sophisticated palate of consumers and driving rapid growth.</p>

    By Category: Conventional (Largest) vs. Organic (Fastest-Growing)

    <p>In the Flavoured Syrups Market, the category of Conventional syrups holds the largest market share. This segment benefits from established consumer preferences and widespread availability. Conventional syrups are popular due to their accessibility and diverse flavor offerings, catering to a broad demographic. On the other hand, the Organic segment is rapidly gaining traction, driven by an increasing consumer preference for natural and health-conscious food products. This shift towards organic ingredients highlights an evolving market landscape where consumers are more selective about their food choices.</p>

    <p>Conventional (Dominant) vs. Organic (Emerging)</p>

    <p>The Conventional category of flavoured syrups remains dominant, appealing to consumers looking for a wide variety of flavors at competitive prices. These syrups often use artificial flavors and preservatives, which can impact taste and health perceptions. However, the Organic category is emerging strongly, positioning itself as a healthier alternative. Organic syrups contain natural ingredients and are often marketed to health-conscious consumers. This emerging segment resonates well with the wellness trend, with an increasing number of consumers preferring organic options, indicating a shift towards sustainability and quality in their dietary choices.</p>

    By Distribution Channel: Food Service (Largest) vs. Retail (Fastest-Growing)

    <p>In the Flavoured Syrups Market, the distribution of market share among the distribution channels indicates a significant preference for the food service sector. This channel traditionally holds the largest share, serving cafes, restaurants, and various food establishments that heavily incorporate flavored syrups into their beverage and dessert offerings. The retail sector, while smaller in comparison, showcases an increasing trend, appealing directly to consumers in supermarkets and convenience stores with accessible packaged options. The growth trends in these segments reveal distinctive drivers. The food service channel remains a dominant player due to the rising popularity of specialty coffee and handcrafted beverages, which are integral to café culture. Conversely, the retail sector is notably fast-growing as consumer preferences shift towards home preparation and DIY solutions, propelled by factors like e-commerce growth and changing lifestyle choices that emphasize convenience and variety.</p>

    <p>Food Service (Dominant) vs. Retail (Emerging)</p>

    <p>The food service distribution channel remains the cornerstone of the Flavoured Syrups Market, characterized by its extensive use in various culinary applications beyond beverages, including sauces and desserts. It benefits from strong relationships with food establishments and an existing customer base that continually seeks innovation in flavor offerings, driving its market position. In contrast, the retail channel is emerging, capturing the interest of home cooks and beverage enthusiasts looking for convenience and quality. Retailers are increasingly diversifying their flavored syrup selections, aided by attractive packaging and branding. This channel is leveraging trends like boutique products and health-conscious ingredients to appeal to a broader market, thus gaining momentum and challenging the food service's dominant status.</p>

    Get more detailed insights about Flavoured Syrups Market Research Report - Forecast to 2032

    Regional Insights

    North America : Market Leader in Flavored Syrups

    North America is the largest market for flavored syrups, accounting for approximately 45% of the global market share. The growth is driven by increasing consumer demand for specialty beverages and the rising trend of home brewing. Regulatory support for food and beverage innovation further fuels this growth, with various initiatives promoting the use of natural ingredients. The U.S. leads this market, followed closely by Canada, which holds about 15% of the market share. The competitive landscape in North America is robust, featuring key players such as Torani, Da Vinci Gourmet, and Ghirardelli. These companies are focusing on product innovation and expanding their distribution channels to meet the growing consumer preferences for unique flavors. The presence of established brands and a strong retail network enhances market accessibility, making it a dynamic environment for flavored syrup products.

    Europe : Emerging Market with Growth Potential

    Europe is witnessing a significant rise in the flavored syrups market, currently holding about 30% of the global share. The growth is driven by increasing consumer interest in gourmet coffee and cocktails, alongside a shift towards premium products. Regulatory frameworks in the EU are increasingly supportive of natural and organic ingredients, which is a key driver for market expansion. The UK and Germany are the largest markets in this region, contributing approximately 10% and 8% respectively to the overall market share. Leading countries in Europe are focusing on product diversification and sustainability, with brands like Monin and Routin 1883 leading the charge. The competitive landscape is characterized by a mix of local and international players, all vying for market share through innovative flavors and marketing strategies. The presence of artisanal brands is also on the rise, catering to niche markets and enhancing consumer choice.

    Asia-Pacific : Rapid Growth in Emerging Markets

    Asia-Pacific is emerging as a significant player in the flavored syrups market, currently holding about 20% of the global share. The region's growth is fueled by increasing urbanization, rising disposable incomes, and a growing café culture. Countries like China and India are leading this growth, with China alone accounting for approximately 10% of the market. Regulatory bodies are also promoting food safety and quality standards, which is beneficial for market expansion. The competitive landscape in Asia-Pacific is becoming increasingly dynamic, with both local and international brands entering the market. Key players such as Da Vinci Gourmet and Sweetbird are expanding their presence through strategic partnerships and product launches. The region is witnessing a trend towards innovative flavors and health-conscious options, catering to the evolving preferences of consumers.

    Middle East and Africa : Untapped Potential in Syrup Market

    The Middle East and Africa region is gradually emerging in the flavored syrups market, currently holding about 5% of the global share. The growth is driven by increasing consumer interest in specialty beverages and the expansion of the food service industry. Regulatory frameworks are evolving to support food safety and quality, which is crucial for market development. Countries like South Africa and the UAE are leading this growth, with South Africa contributing approximately 3% to the overall market share. The competitive landscape is characterized by a mix of local and international players, with brands like Fabbri 1905 and Finlandia making inroads into the market. The region is witnessing a growing trend towards premium and artisanal products, catering to a more discerning consumer base. As the market matures, there is significant potential for growth, particularly in urban areas where café culture is on the rise.

    Key Players and Competitive Insights

    The Flavoured Syrups Market is currently characterized by a dynamic competitive landscape, driven by evolving consumer preferences and an increasing demand for diverse flavor profiles across various applications, including beverages and desserts. Key players such as Monin (FR), Torani (US), and Da Vinci Gourmet (US) are strategically positioned to leverage innovation and regional expansion to capture market share. Monin (FR) focuses on premium quality and sustainability, while Torani (US) emphasizes its heritage and product authenticity. Da Vinci Gourmet (US) is known for its extensive range of flavors, appealing to both retail and foodservice sectors. Collectively, these strategies foster a competitive environment that encourages differentiation through quality and innovation.

    In terms of business tactics, companies are increasingly localizing manufacturing to reduce lead times and enhance supply chain efficiency. The Flavoured Syrups Market appears moderately fragmented, with several players vying for dominance. The collective influence of these key players shapes market dynamics, as they engage in strategic partnerships and collaborations to enhance their product offerings and expand their geographical reach.

    In August 2025, Monin (FR) announced the launch of a new line of organic flavored syrups, which aligns with the growing consumer trend towards health-conscious products. This strategic move not only reinforces Monin's commitment to sustainability but also positions the company to attract a broader customer base that prioritizes organic ingredients. The introduction of these products is likely to enhance Monin's competitive edge in the premium segment of the market.

    In September 2025, Torani (US) unveiled a partnership with a leading coffee chain to develop exclusive flavored syrups tailored for seasonal promotions. This collaboration is indicative of Torani's strategy to deepen its penetration in the foodservice sector, leveraging its brand recognition to create unique offerings that resonate with consumers. Such partnerships may enhance brand loyalty and drive sales through innovative product placements.

    In July 2025, Da Vinci Gourmet (US) expanded its distribution network by entering into a strategic alliance with a major online retailer, thereby enhancing its e-commerce capabilities. This move is particularly significant as it allows Da Vinci to tap into the growing trend of online shopping, especially among younger consumers who prefer the convenience of purchasing gourmet products online. The expansion into e-commerce is likely to bolster Da Vinci's market presence and accessibility.

    As of October 2025, the Flavoured Syrups Market is witnessing trends such as digitalization, sustainability, and the integration of artificial intelligence in product development and marketing strategies. Strategic alliances are increasingly shaping the competitive landscape, enabling companies to pool resources and expertise. Looking ahead, competitive differentiation is expected to evolve, with a notable shift from price-based competition towards innovation, technology adoption, and supply chain reliability. Companies that can effectively leverage these trends are likely to secure a more robust position in the market.

    Key Companies in the Flavoured Syrups Market market include

    Industry Developments

    Future Outlook

    Flavoured Syrups Market Future Outlook

    <p>The Flavoured Syrups Market is projected to grow at a 4.45% CAGR from 2024 to 2035, driven by increasing consumer demand for innovative beverage options and health-conscious formulations.</p>

    New opportunities lie in:

    • <p>Expansion into organic and natural syrup lines</p>
    • <p>Development of customizable syrup dispensers for cafes</p>
    • <p>Partnerships with beverage brands for exclusive syrup flavors</p>

    <p>By 2035, the Flavoured Syrups Market is expected to achieve robust growth and diversification.</p>

    Market Segmentation

    Flavoured Syrups Market Category Outlook

    • Conventional
    • Organic

    Flavoured Syrups Market Flavor Type Outlook

    • Fruits
    • Coffee
    • Chocolate
    • Vanilla
    • Mint
    • Nuts
    • Caramel
    • Blends

    Flavoured Syrups Market Distribution Channel Outlook

    • Food Service
    • Retail

    Report Scope

    MARKET SIZE 202438.77(USD Billion)
    MARKET SIZE 202540.5(USD Billion)
    MARKET SIZE 203562.6(USD Billion)
    COMPOUND ANNUAL GROWTH RATE (CAGR)4.45% (2024 - 2035)
    REPORT COVERAGERevenue Forecast, Competitive Landscape, Growth Factors, and Trends
    BASE YEAR2024
    Market Forecast Period2025 - 2035
    Historical Data2019 - 2024
    Market Forecast UnitsUSD Billion
    Key Companies ProfiledMarket analysis in progress
    Segments CoveredMarket segmentation analysis in progress
    Key Market OpportunitiesGrowing consumer preference for natural ingredients drives innovation in the Flavoured Syrups Market.
    Key Market DynamicsRising consumer preference for natural ingredients drives innovation and competition in the flavoured syrups market.
    Countries CoveredNorth America, Europe, APAC, South America, MEA

    FAQs

    How much is the Flavoured Syrups market?

    The Flavoured Syrups market size was valued at USD 36.89 Billion in 2023.

    What is the growth rate of the Flavoured Syrups market?

    The market is projected to grow at a CAGR of 4.45% during the forecast period, 2024-2032.

    Which region held the largest market share in the Flavoured Syrups market?

    Asia Pacific had the largest share in the market

    Who are the key players in the Flavoured Syrups market?

    The key players in the market are The J.M. Smucker Company (US), Wholesome Sweeteners Inc. (US), Conagra Brands, Inc. (US), VKL Seasoning Pvt. Ltd. (India), Nestlé S.A. (Switzerland).

    Which flavor type led the Flavoured Syrups market?

    The fruit category dominated the market in 2023.

    Which distribution channel had the largest market share in the Flavoured Syrups market?

    The fruit retail had the largest share in the market.

    1. SECTION I: EXECUTIVE SUMMARY AND KEY HIGHLIGHTS
      1. | 1.1 EXECUTIVE SUMMARY
      2. | | 1.1.1 Market Overview
      3. | | 1.1.2 Key Findings
      4. | | 1.1.3 Market Segmentation
      5. | | 1.1.4 Competitive Landscape
      6. | | 1.1.5 Challenges and Opportunities
      7. | | 1.1.6 Future Outlook
    2. SECTION II: SCOPING, METHODOLOGY AND MARKET STRUCTURE
      1. | 2.1 MARKET INTRODUCTION
      2. | | 2.1.1 Definition
      3. | | 2.1.2 Scope of the study
      4. | | | 2.1.2.1 Research Objective
      5. | | | 2.1.2.2 Assumption
      6. | | | 2.1.2.3 Limitations
      7. | 2.2 RESEARCH METHODOLOGY
      8. | | 2.2.1 Overview
      9. | | 2.2.2 Data Mining
      10. | | 2.2.3 Secondary Research
      11. | | 2.2.4 Primary Research
      12. | | | 2.2.4.1 Primary Interviews and Information Gathering Process
      13. | | | 2.2.4.2 Breakdown of Primary Respondents
      14. | | 2.2.5 Forecasting Model
      15. | | 2.2.6 Market Size Estimation
      16. | | | 2.2.6.1 Bottom-Up Approach
      17. | | | 2.2.6.2 Top-Down Approach
      18. | | 2.2.7 Data Triangulation
      19. | | 2.2.8 Validation
    3. SECTION III: QUALITATIVE ANALYSIS
      1. | 3.1 MARKET DYNAMICS
      2. | | 3.1.1 Overview
      3. | | 3.1.2 Drivers
      4. | | 3.1.3 Restraints
      5. | | 3.1.4 Opportunities
      6. | 3.2 MARKET FACTOR ANALYSIS
      7. | | 3.2.1 Value chain Analysis
      8. | | 3.2.2 Porter's Five Forces Analysis
      9. | | | 3.2.2.1 Bargaining Power of Suppliers
      10. | | | 3.2.2.2 Bargaining Power of Buyers
      11. | | | 3.2.2.3 Threat of New Entrants
      12. | | | 3.2.2.4 Threat of Substitutes
      13. | | | 3.2.2.5 Intensity of Rivalry
      14. | | 3.2.3 COVID-19 Impact Analysis
      15. | | | 3.2.3.1 Market Impact Analysis
      16. | | | 3.2.3.2 Regional Impact
      17. | | | 3.2.3.3 Opportunity and Threat Analysis
    4. SECTION IV: QUANTITATIVE ANALYSIS
      1. | 4.1 Food, Beverages & Nutrition, BY Flavor Type (USD Billion)
      2. | | 4.1.1 Fruits
      3. | | 4.1.2 Coffee
      4. | | 4.1.3 Chocolate
      5. | | 4.1.4 Vanilla
      6. | | 4.1.5 Mint
      7. | | 4.1.6 Nuts
      8. | | 4.1.7 Caramel
      9. | | 4.1.8 Blends
      10. | 4.2 Food, Beverages & Nutrition, BY Category (USD Billion)
      11. | | 4.2.1 Conventional
      12. | | 4.2.2 Organic
      13. | 4.3 Food, Beverages & Nutrition, BY Distribution Channel (USD Billion)
      14. | | 4.3.1 Food Service
      15. | | 4.3.2 Retail
      16. | 4.4 Food, Beverages & Nutrition, BY Region (USD Billion)
      17. | | 4.4.1 North America
      18. | | | 4.4.1.1 US
      19. | | | 4.4.1.2 Canada
      20. | | 4.4.2 Europe
      21. | | | 4.4.2.1 Germany
      22. | | | 4.4.2.2 UK
      23. | | | 4.4.2.3 France
      24. | | | 4.4.2.4 Russia
      25. | | | 4.4.2.5 Italy
      26. | | | 4.4.2.6 Spain
      27. | | | 4.4.2.7 Rest of Europe
      28. | | 4.4.3 APAC
      29. | | | 4.4.3.1 China
      30. | | | 4.4.3.2 India
      31. | | | 4.4.3.3 Japan
      32. | | | 4.4.3.4 South Korea
      33. | | | 4.4.3.5 Malaysia
      34. | | | 4.4.3.6 Thailand
      35. | | | 4.4.3.7 Indonesia
      36. | | | 4.4.3.8 Rest of APAC
      37. | | 4.4.4 South America
      38. | | | 4.4.4.1 Brazil
      39. | | | 4.4.4.2 Mexico
      40. | | | 4.4.4.3 Argentina
      41. | | | 4.4.4.4 Rest of South America
      42. | | 4.4.5 MEA
      43. | | | 4.4.5.1 GCC Countries
      44. | | | 4.4.5.2 South Africa
      45. | | | 4.4.5.3 Rest of MEA
    5. SECTION V: COMPETITIVE ANALYSIS
      1. | 5.1 Competitive Landscape
      2. | | 5.1.1 Overview
      3. | | 5.1.2 Competitive Analysis
      4. | | 5.1.3 Market share Analysis
      5. | | 5.1.4 Major Growth Strategy in the Food, Beverages & Nutrition
      6. | | 5.1.5 Competitive Benchmarking
      7. | | 5.1.6 Leading Players in Terms of Number of Developments in the Food, Beverages & Nutrition
      8. | | 5.1.7 Key developments and growth strategies
      9. | | | 5.1.7.1 New Product Launch/Service Deployment
      10. | | | 5.1.7.2 Merger & Acquisitions
      11. | | | 5.1.7.3 Joint Ventures
      12. | | 5.1.8 Major Players Financial Matrix
      13. | | | 5.1.8.1 Sales and Operating Income
      14. | | | 5.1.8.2 Major Players R&D Expenditure. 2023
      15. | 5.2 Company Profiles
      16. | | 5.2.1 Monin (FR)
      17. | | | 5.2.1.1 Financial Overview
      18. | | | 5.2.1.2 Products Offered
      19. | | | 5.2.1.3 Key Developments
      20. | | | 5.2.1.4 SWOT Analysis
      21. | | | 5.2.1.5 Key Strategies
      22. | | 5.2.2 Torani (US)
      23. | | | 5.2.2.1 Financial Overview
      24. | | | 5.2.2.2 Products Offered
      25. | | | 5.2.2.3 Key Developments
      26. | | | 5.2.2.4 SWOT Analysis
      27. | | | 5.2.2.5 Key Strategies
      28. | | 5.2.3 Da Vinci Gourmet (US)
      29. | | | 5.2.3.1 Financial Overview
      30. | | | 5.2.3.2 Products Offered
      31. | | | 5.2.3.3 Key Developments
      32. | | | 5.2.3.4 SWOT Analysis
      33. | | | 5.2.3.5 Key Strategies
      34. | | 5.2.4 Fabbri 1905 (IT)
      35. | | | 5.2.4.1 Financial Overview
      36. | | | 5.2.4.2 Products Offered
      37. | | | 5.2.4.3 Key Developments
      38. | | | 5.2.4.4 SWOT Analysis
      39. | | | 5.2.4.5 Key Strategies
      40. | | 5.2.5 Ghirardelli (US)
      41. | | | 5.2.5.1 Financial Overview
      42. | | | 5.2.5.2 Products Offered
      43. | | | 5.2.5.3 Key Developments
      44. | | | 5.2.5.4 SWOT Analysis
      45. | | | 5.2.5.5 Key Strategies
      46. | | 5.2.6 Routin 1883 (FR)
      47. | | | 5.2.6.1 Financial Overview
      48. | | | 5.2.6.2 Products Offered
      49. | | | 5.2.6.3 Key Developments
      50. | | | 5.2.6.4 SWOT Analysis
      51. | | | 5.2.6.5 Key Strategies
      52. | | 5.2.7 Sweetbird (GB)
      53. | | | 5.2.7.1 Financial Overview
      54. | | | 5.2.7.2 Products Offered
      55. | | | 5.2.7.3 Key Developments
      56. | | | 5.2.7.4 SWOT Analysis
      57. | | | 5.2.7.5 Key Strategies
      58. | | 5.2.8 Jordan's Skinny Syrups (US)
      59. | | | 5.2.8.1 Financial Overview
      60. | | | 5.2.8.2 Products Offered
      61. | | | 5.2.8.3 Key Developments
      62. | | | 5.2.8.4 SWOT Analysis
      63. | | | 5.2.8.5 Key Strategies
      64. | | 5.2.9 Finlandia (FI)
      65. | | | 5.2.9.1 Financial Overview
      66. | | | 5.2.9.2 Products Offered
      67. | | | 5.2.9.3 Key Developments
      68. | | | 5.2.9.4 SWOT Analysis
      69. | | | 5.2.9.5 Key Strategies
      70. | 5.3 Appendix
      71. | | 5.3.1 References
      72. | | 5.3.2 Related Reports
    6. LIST OF FIGURES
      1. | 6.1 MARKET SYNOPSIS
      2. | 6.2 NORTH AMERICA MARKET ANALYSIS
      3. | 6.3 US MARKET ANALYSIS BY FLAVOR TYPE
      4. | 6.4 US MARKET ANALYSIS BY CATEGORY
      5. | 6.5 US MARKET ANALYSIS BY DISTRIBUTION CHANNEL
      6. | 6.6 CANADA MARKET ANALYSIS BY FLAVOR TYPE
      7. | 6.7 CANADA MARKET ANALYSIS BY CATEGORY
      8. | 6.8 CANADA MARKET ANALYSIS BY DISTRIBUTION CHANNEL
      9. | 6.9 EUROPE MARKET ANALYSIS
      10. | 6.10 GERMANY MARKET ANALYSIS BY FLAVOR TYPE
      11. | 6.11 GERMANY MARKET ANALYSIS BY CATEGORY
      12. | 6.12 GERMANY MARKET ANALYSIS BY DISTRIBUTION CHANNEL
      13. | 6.13 UK MARKET ANALYSIS BY FLAVOR TYPE
      14. | 6.14 UK MARKET ANALYSIS BY CATEGORY
      15. | 6.15 UK MARKET ANALYSIS BY DISTRIBUTION CHANNEL
      16. | 6.16 FRANCE MARKET ANALYSIS BY FLAVOR TYPE
      17. | 6.17 FRANCE MARKET ANALYSIS BY CATEGORY
      18. | 6.18 FRANCE MARKET ANALYSIS BY DISTRIBUTION CHANNEL
      19. | 6.19 RUSSIA MARKET ANALYSIS BY FLAVOR TYPE
      20. | 6.20 RUSSIA MARKET ANALYSIS BY CATEGORY
      21. | 6.21 RUSSIA MARKET ANALYSIS BY DISTRIBUTION CHANNEL
      22. | 6.22 ITALY MARKET ANALYSIS BY FLAVOR TYPE
      23. | 6.23 ITALY MARKET ANALYSIS BY CATEGORY
      24. | 6.24 ITALY MARKET ANALYSIS BY DISTRIBUTION CHANNEL
      25. | 6.25 SPAIN MARKET ANALYSIS BY FLAVOR TYPE
      26. | 6.26 SPAIN MARKET ANALYSIS BY CATEGORY
      27. | 6.27 SPAIN MARKET ANALYSIS BY DISTRIBUTION CHANNEL
      28. | 6.28 REST OF EUROPE MARKET ANALYSIS BY FLAVOR TYPE
      29. | 6.29 REST OF EUROPE MARKET ANALYSIS BY CATEGORY
      30. | 6.30 REST OF EUROPE MARKET ANALYSIS BY DISTRIBUTION CHANNEL
      31. | 6.31 APAC MARKET ANALYSIS
      32. | 6.32 CHINA MARKET ANALYSIS BY FLAVOR TYPE
      33. | 6.33 CHINA MARKET ANALYSIS BY CATEGORY
      34. | 6.34 CHINA MARKET ANALYSIS BY DISTRIBUTION CHANNEL
      35. | 6.35 INDIA MARKET ANALYSIS BY FLAVOR TYPE
      36. | 6.36 INDIA MARKET ANALYSIS BY CATEGORY
      37. | 6.37 INDIA MARKET ANALYSIS BY DISTRIBUTION CHANNEL
      38. | 6.38 JAPAN MARKET ANALYSIS BY FLAVOR TYPE
      39. | 6.39 JAPAN MARKET ANALYSIS BY CATEGORY
      40. | 6.40 JAPAN MARKET ANALYSIS BY DISTRIBUTION CHANNEL
      41. | 6.41 SOUTH KOREA MARKET ANALYSIS BY FLAVOR TYPE
      42. | 6.42 SOUTH KOREA MARKET ANALYSIS BY CATEGORY
      43. | 6.43 SOUTH KOREA MARKET ANALYSIS BY DISTRIBUTION CHANNEL
      44. | 6.44 MALAYSIA MARKET ANALYSIS BY FLAVOR TYPE
      45. | 6.45 MALAYSIA MARKET ANALYSIS BY CATEGORY
      46. | 6.46 MALAYSIA MARKET ANALYSIS BY DISTRIBUTION CHANNEL
      47. | 6.47 THAILAND MARKET ANALYSIS BY FLAVOR TYPE
      48. | 6.48 THAILAND MARKET ANALYSIS BY CATEGORY
      49. | 6.49 THAILAND MARKET ANALYSIS BY DISTRIBUTION CHANNEL
      50. | 6.50 INDONESIA MARKET ANALYSIS BY FLAVOR TYPE
      51. | 6.51 INDONESIA MARKET ANALYSIS BY CATEGORY
      52. | 6.52 INDONESIA MARKET ANALYSIS BY DISTRIBUTION CHANNEL
      53. | 6.53 REST OF APAC MARKET ANALYSIS BY FLAVOR TYPE
      54. | 6.54 REST OF APAC MARKET ANALYSIS BY CATEGORY
      55. | 6.55 REST OF APAC MARKET ANALYSIS BY DISTRIBUTION CHANNEL
      56. | 6.56 SOUTH AMERICA MARKET ANALYSIS
      57. | 6.57 BRAZIL MARKET ANALYSIS BY FLAVOR TYPE
      58. | 6.58 BRAZIL MARKET ANALYSIS BY CATEGORY
      59. | 6.59 BRAZIL MARKET ANALYSIS BY DISTRIBUTION CHANNEL
      60. | 6.60 MEXICO MARKET ANALYSIS BY FLAVOR TYPE
      61. | 6.61 MEXICO MARKET ANALYSIS BY CATEGORY
      62. | 6.62 MEXICO MARKET ANALYSIS BY DISTRIBUTION CHANNEL
      63. | 6.63 ARGENTINA MARKET ANALYSIS BY FLAVOR TYPE
      64. | 6.64 ARGENTINA MARKET ANALYSIS BY CATEGORY
      65. | 6.65 ARGENTINA MARKET ANALYSIS BY DISTRIBUTION CHANNEL
      66. | 6.66 REST OF SOUTH AMERICA MARKET ANALYSIS BY FLAVOR TYPE
      67. | 6.67 REST OF SOUTH AMERICA MARKET ANALYSIS BY CATEGORY
      68. | 6.68 REST OF SOUTH AMERICA MARKET ANALYSIS BY DISTRIBUTION CHANNEL
      69. | 6.69 MEA MARKET ANALYSIS
      70. | 6.70 GCC COUNTRIES MARKET ANALYSIS BY FLAVOR TYPE
      71. | 6.71 GCC COUNTRIES MARKET ANALYSIS BY CATEGORY
      72. | 6.72 GCC COUNTRIES MARKET ANALYSIS BY DISTRIBUTION CHANNEL
      73. | 6.73 SOUTH AFRICA MARKET ANALYSIS BY FLAVOR TYPE
      74. | 6.74 SOUTH AFRICA MARKET ANALYSIS BY CATEGORY
      75. | 6.75 SOUTH AFRICA MARKET ANALYSIS BY DISTRIBUTION CHANNEL
      76. | 6.76 REST OF MEA MARKET ANALYSIS BY FLAVOR TYPE
      77. | 6.77 REST OF MEA MARKET ANALYSIS BY CATEGORY
      78. | 6.78 REST OF MEA MARKET ANALYSIS BY DISTRIBUTION CHANNEL
      79. | 6.79 KEY BUYING CRITERIA OF FOOD, BEVERAGES & NUTRITION
      80. | 6.80 RESEARCH PROCESS OF MRFR
      81. | 6.81 DRO ANALYSIS OF FOOD, BEVERAGES & NUTRITION
      82. | 6.82 DRIVERS IMPACT ANALYSIS: FOOD, BEVERAGES & NUTRITION
      83. | 6.83 RESTRAINTS IMPACT ANALYSIS: FOOD, BEVERAGES & NUTRITION
      84. | 6.84 SUPPLY / VALUE CHAIN: FOOD, BEVERAGES & NUTRITION
      85. | 6.85 FOOD, BEVERAGES & NUTRITION, BY FLAVOR TYPE, 2024 (% SHARE)
      86. | 6.86 FOOD, BEVERAGES & NUTRITION, BY FLAVOR TYPE, 2024 TO 2035 (USD Billion)
      87. | 6.87 FOOD, BEVERAGES & NUTRITION, BY CATEGORY, 2024 (% SHARE)
      88. | 6.88 FOOD, BEVERAGES & NUTRITION, BY CATEGORY, 2024 TO 2035 (USD Billion)
      89. | 6.89 FOOD, BEVERAGES & NUTRITION, BY DISTRIBUTION CHANNEL, 2024 (% SHARE)
      90. | 6.90 FOOD, BEVERAGES & NUTRITION, BY DISTRIBUTION CHANNEL, 2024 TO 2035 (USD Billion)
      91. | 6.91 BENCHMARKING OF MAJOR COMPETITORS
    7. LIST OF TABLES
      1. | 7.1 LIST OF ASSUMPTIONS
      2. | | 7.1.1
      3. | 7.2 North America MARKET SIZE ESTIMATES; FORECAST
      4. | | 7.2.1 BY FLAVOR TYPE, 2025-2035 (USD Billion)
      5. | | 7.2.2 BY CATEGORY, 2025-2035 (USD Billion)
      6. | | 7.2.3 BY DISTRIBUTION CHANNEL, 2025-2035 (USD Billion)
      7. | 7.3 US MARKET SIZE ESTIMATES; FORECAST
      8. | | 7.3.1 BY FLAVOR TYPE, 2025-2035 (USD Billion)
      9. | | 7.3.2 BY CATEGORY, 2025-2035 (USD Billion)
      10. | | 7.3.3 BY DISTRIBUTION CHANNEL, 2025-2035 (USD Billion)
      11. | 7.4 Canada MARKET SIZE ESTIMATES; FORECAST
      12. | | 7.4.1 BY FLAVOR TYPE, 2025-2035 (USD Billion)
      13. | | 7.4.2 BY CATEGORY, 2025-2035 (USD Billion)
      14. | | 7.4.3 BY DISTRIBUTION CHANNEL, 2025-2035 (USD Billion)
      15. | 7.5 Europe MARKET SIZE ESTIMATES; FORECAST
      16. | | 7.5.1 BY FLAVOR TYPE, 2025-2035 (USD Billion)
      17. | | 7.5.2 BY CATEGORY, 2025-2035 (USD Billion)
      18. | | 7.5.3 BY DISTRIBUTION CHANNEL, 2025-2035 (USD Billion)
      19. | 7.6 Germany MARKET SIZE ESTIMATES; FORECAST
      20. | | 7.6.1 BY FLAVOR TYPE, 2025-2035 (USD Billion)
      21. | | 7.6.2 BY CATEGORY, 2025-2035 (USD Billion)
      22. | | 7.6.3 BY DISTRIBUTION CHANNEL, 2025-2035 (USD Billion)
      23. | 7.7 UK MARKET SIZE ESTIMATES; FORECAST
      24. | | 7.7.1 BY FLAVOR TYPE, 2025-2035 (USD Billion)
      25. | | 7.7.2 BY CATEGORY, 2025-2035 (USD Billion)
      26. | | 7.7.3 BY DISTRIBUTION CHANNEL, 2025-2035 (USD Billion)
      27. | 7.8 France MARKET SIZE ESTIMATES; FORECAST
      28. | | 7.8.1 BY FLAVOR TYPE, 2025-2035 (USD Billion)
      29. | | 7.8.2 BY CATEGORY, 2025-2035 (USD Billion)
      30. | | 7.8.3 BY DISTRIBUTION CHANNEL, 2025-2035 (USD Billion)
      31. | 7.9 Russia MARKET SIZE ESTIMATES; FORECAST
      32. | | 7.9.1 BY FLAVOR TYPE, 2025-2035 (USD Billion)
      33. | | 7.9.2 BY CATEGORY, 2025-2035 (USD Billion)
      34. | | 7.9.3 BY DISTRIBUTION CHANNEL, 2025-2035 (USD Billion)
      35. | 7.10 Italy MARKET SIZE ESTIMATES; FORECAST
      36. | | 7.10.1 BY FLAVOR TYPE, 2025-2035 (USD Billion)
      37. | | 7.10.2 BY CATEGORY, 2025-2035 (USD Billion)
      38. | | 7.10.3 BY DISTRIBUTION CHANNEL, 2025-2035 (USD Billion)
      39. | 7.11 Spain MARKET SIZE ESTIMATES; FORECAST
      40. | | 7.11.1 BY FLAVOR TYPE, 2025-2035 (USD Billion)
      41. | | 7.11.2 BY CATEGORY, 2025-2035 (USD Billion)
      42. | | 7.11.3 BY DISTRIBUTION CHANNEL, 2025-2035 (USD Billion)
      43. | 7.12 Rest of Europe MARKET SIZE ESTIMATES; FORECAST
      44. | | 7.12.1 BY FLAVOR TYPE, 2025-2035 (USD Billion)
      45. | | 7.12.2 BY CATEGORY, 2025-2035 (USD Billion)
      46. | | 7.12.3 BY DISTRIBUTION CHANNEL, 2025-2035 (USD Billion)
      47. | 7.13 APAC MARKET SIZE ESTIMATES; FORECAST
      48. | | 7.13.1 BY FLAVOR TYPE, 2025-2035 (USD Billion)
      49. | | 7.13.2 BY CATEGORY, 2025-2035 (USD Billion)
      50. | | 7.13.3 BY DISTRIBUTION CHANNEL, 2025-2035 (USD Billion)
      51. | 7.14 China MARKET SIZE ESTIMATES; FORECAST
      52. | | 7.14.1 BY FLAVOR TYPE, 2025-2035 (USD Billion)
      53. | | 7.14.2 BY CATEGORY, 2025-2035 (USD Billion)
      54. | | 7.14.3 BY DISTRIBUTION CHANNEL, 2025-2035 (USD Billion)
      55. | 7.15 India MARKET SIZE ESTIMATES; FORECAST
      56. | | 7.15.1 BY FLAVOR TYPE, 2025-2035 (USD Billion)
      57. | | 7.15.2 BY CATEGORY, 2025-2035 (USD Billion)
      58. | | 7.15.3 BY DISTRIBUTION CHANNEL, 2025-2035 (USD Billion)
      59. | 7.16 Japan MARKET SIZE ESTIMATES; FORECAST
      60. | | 7.16.1 BY FLAVOR TYPE, 2025-2035 (USD Billion)
      61. | | 7.16.2 BY CATEGORY, 2025-2035 (USD Billion)
      62. | | 7.16.3 BY DISTRIBUTION CHANNEL, 2025-2035 (USD Billion)
      63. | 7.17 South Korea MARKET SIZE ESTIMATES; FORECAST
      64. | | 7.17.1 BY FLAVOR TYPE, 2025-2035 (USD Billion)
      65. | | 7.17.2 BY CATEGORY, 2025-2035 (USD Billion)
      66. | | 7.17.3 BY DISTRIBUTION CHANNEL, 2025-2035 (USD Billion)
      67. | 7.18 Malaysia MARKET SIZE ESTIMATES; FORECAST
      68. | | 7.18.1 BY FLAVOR TYPE, 2025-2035 (USD Billion)
      69. | | 7.18.2 BY CATEGORY, 2025-2035 (USD Billion)
      70. | | 7.18.3 BY DISTRIBUTION CHANNEL, 2025-2035 (USD Billion)
      71. | 7.19 Thailand MARKET SIZE ESTIMATES; FORECAST
      72. | | 7.19.1 BY FLAVOR TYPE, 2025-2035 (USD Billion)
      73. | | 7.19.2 BY CATEGORY, 2025-2035 (USD Billion)
      74. | | 7.19.3 BY DISTRIBUTION CHANNEL, 2025-2035 (USD Billion)
      75. | 7.20 Indonesia MARKET SIZE ESTIMATES; FORECAST
      76. | | 7.20.1 BY FLAVOR TYPE, 2025-2035 (USD Billion)
      77. | | 7.20.2 BY CATEGORY, 2025-2035 (USD Billion)
      78. | | 7.20.3 BY DISTRIBUTION CHANNEL, 2025-2035 (USD Billion)
      79. | 7.21 Rest of APAC MARKET SIZE ESTIMATES; FORECAST
      80. | | 7.21.1 BY FLAVOR TYPE, 2025-2035 (USD Billion)
      81. | | 7.21.2 BY CATEGORY, 2025-2035 (USD Billion)
      82. | | 7.21.3 BY DISTRIBUTION CHANNEL, 2025-2035 (USD Billion)
      83. | 7.22 South America MARKET SIZE ESTIMATES; FORECAST
      84. | | 7.22.1 BY FLAVOR TYPE, 2025-2035 (USD Billion)
      85. | | 7.22.2 BY CATEGORY, 2025-2035 (USD Billion)
      86. | | 7.22.3 BY DISTRIBUTION CHANNEL, 2025-2035 (USD Billion)
      87. | 7.23 Brazil MARKET SIZE ESTIMATES; FORECAST
      88. | | 7.23.1 BY FLAVOR TYPE, 2025-2035 (USD Billion)
      89. | | 7.23.2 BY CATEGORY, 2025-2035 (USD Billion)
      90. | | 7.23.3 BY DISTRIBUTION CHANNEL, 2025-2035 (USD Billion)
      91. | 7.24 Mexico MARKET SIZE ESTIMATES; FORECAST
      92. | | 7.24.1 BY FLAVOR TYPE, 2025-2035 (USD Billion)
      93. | | 7.24.2 BY CATEGORY, 2025-2035 (USD Billion)
      94. | | 7.24.3 BY DISTRIBUTION CHANNEL, 2025-2035 (USD Billion)
      95. | 7.25 Argentina MARKET SIZE ESTIMATES; FORECAST
      96. | | 7.25.1 BY FLAVOR TYPE, 2025-2035 (USD Billion)
      97. | | 7.25.2 BY CATEGORY, 2025-2035 (USD Billion)
      98. | | 7.25.3 BY DISTRIBUTION CHANNEL, 2025-2035 (USD Billion)
      99. | 7.26 Rest of South America MARKET SIZE ESTIMATES; FORECAST
      100. | | 7.26.1 BY FLAVOR TYPE, 2025-2035 (USD Billion)
      101. | | 7.26.2 BY CATEGORY, 2025-2035 (USD Billion)
      102. | | 7.26.3 BY DISTRIBUTION CHANNEL, 2025-2035 (USD Billion)
      103. | 7.27 MEA MARKET SIZE ESTIMATES; FORECAST
      104. | | 7.27.1 BY FLAVOR TYPE, 2025-2035 (USD Billion)
      105. | | 7.27.2 BY CATEGORY, 2025-2035 (USD Billion)
      106. | | 7.27.3 BY DISTRIBUTION CHANNEL, 2025-2035 (USD Billion)
      107. | 7.28 GCC Countries MARKET SIZE ESTIMATES; FORECAST
      108. | | 7.28.1 BY FLAVOR TYPE, 2025-2035 (USD Billion)
      109. | | 7.28.2 BY CATEGORY, 2025-2035 (USD Billion)
      110. | | 7.28.3 BY DISTRIBUTION CHANNEL, 2025-2035 (USD Billion)
      111. | 7.29 South Africa MARKET SIZE ESTIMATES; FORECAST
      112. | | 7.29.1 BY FLAVOR TYPE, 2025-2035 (USD Billion)
      113. | | 7.29.2 BY CATEGORY, 2025-2035 (USD Billion)
      114. | | 7.29.3 BY DISTRIBUTION CHANNEL, 2025-2035 (USD Billion)
      115. | 7.30 Rest of MEA MARKET SIZE ESTIMATES; FORECAST
      116. | | 7.30.1 BY FLAVOR TYPE, 2025-2035 (USD Billion)
      117. | | 7.30.2 BY CATEGORY, 2025-2035 (USD Billion)
      118. | | 7.30.3 BY DISTRIBUTION CHANNEL, 2025-2035 (USD Billion)
      119. | 7.31 PRODUCT LAUNCH/PRODUCT DEVELOPMENT/APPROVAL
      120. | | 7.31.1
      121. | 7.32 ACQUISITION/PARTNERSHIP
      122. | | 7.32.1

    Flavoured Syrups Market Segmentation

    Flavoured Syrups Flavoured Type Outlook (USD Billion, 2018-2032)

    • Fruits

    • Coffee

    • Chocolate

    • Vanilla

    • Mint

    • Nuts

    • Caramel

    • Blends

    Flavoured Syrups Category Outlook (USD Billion, 2018-2032)

    • Conventional

    • Organic

    Flavoured Syrups Distribution Channel Outlook (USD Billion, 2018-2032)

    • Food Service

    • Food Rental

    Flavoured Syrups Regional Outlook (USD Billion, 2018-2032)

    • North America Outlook (USD Billion, 2018-2032)

      • North America Flavoured Syrups by Flavoured Type

        • Fruits

        • Coffee

        • Chocolate

        • Vanilla

        • Mint

        • Nuts

        • Caramel

        • Blends

      • North America Flavoured Syrups by Category

        • Conventional

        • Organic

      • North America Flavoured Syrups by Distribution Channel

        • Food Service

        • Food Rental

      • US Outlook (USD Billion, 2018-2032)

      • US Flavoured Syrups by Flavoured Type

        • Fruits

        • Coffee

        • Chocolate

        • Vanilla

        • Mint

        • Nuts

        • Caramel

        • Blends

      • US Flavoured Syrups by Category

        • Conventional

        • Organic

      • US Flavoured Syrups by Distribution Channel

        • Food Service

        • Food Rental

      • CANADA Outlook (USD Billion, 2018-2032)

      • CANADA Flavoured Syrups by Flavoured Type

        • Fruits

        • Coffee

        • Chocolate

        • Vanilla

        • Mint

        • Nuts

        • Caramel

        • Blends

      • CANADA Flavoured Syrups by Category

        • Conventional

        • Organic

      • CANADA Flavoured Syrups by Distribution Channel

        • Food Service

        • Food Rental

    • Europe Outlook (USD Billion, 2018-2032)

      • Europe Flavoured Syrups by Flavoured Type

        • Fruits

        • Coffee

        • Chocolate

        • Vanilla

        • Mint

        • Nuts

        • Caramel

        • Blends

      • Europe Flavoured Syrups by Category

        • Conventional

        • Organic

      • Europe Flavoured Syrups by Distribution Channel

        • Food Service

        • Food Rental

      • Germany Outlook (USD Billion, 2018-2032)

      • Germany Flavoured Syrups by Flavoured Type

        • Fruits

        • Coffee

        • Chocolate

        • Vanilla

        • Mint

        • Nuts

        • Caramel

        • Blends

      • Germany Flavoured Syrups by Category

        • Conventional

        • Organic

      • Germany Flavoured Syrups by Distribution Channel

        • Food Service

        • Food Rental

      • France Outlook (USD Billion, 2018-2032)

      • France Flavoured Syrups by Flavoured Type

        • Fruits

        • Coffee

        • Chocolate

        • Vanilla

        • Mint

        • Nuts

        • Caramel

        • Blends

      • France Flavoured Syrups by Category

        • Conventional

        • Organic

      • France Flavoured Syrups by Distribution Channel

        • Food Service

        • Food Rental

      • UK Outlook (USD Billion, 2018-2032)

      • UK Flavoured Syrups by Flavoured Type

        • Fruits

        • Coffee

        • Chocolate

        • Vanilla

        • Mint

        • Nuts

        • Caramel

        • Blends

      • UK Flavoured Syrups by Category

        • Conventional

        • Organic

      • UK Flavoured Syrups by Distribution Channel

        • Food Service

        • Food Rental

      • ITALY Outlook (USD Billion, 2018-2032)

      • ITALY Flavoured Syrups by Flavoured Type

        • Food

        • Beverages

        • Supplements

      • ITALY Flavoured Syrups by Distribution Channel

        • Food Service

        • Food Rental

      • SPAIN Outlook (USD Billion, 2018-2032)

      • Spain Flavoured Syrups by Flavoured Type

        • Fruits

        • Coffee

        • Chocolate

        • Vanilla

        • Mint

        • Nuts

        • Caramel

        • Blends

      • Spain Flavoured Syrups by Category

        • Conventional

        • Organic

      • Spain Flavoured Syrups by Distribution Channel

        • Food Service

        • Food Rental

      • Rest Of Europe Outlook (USD Billion, 2018-2032)

      • Rest Of Europe Flavoured Syrups by Flavoured Type

        • Fruits

        • Coffee

        • Chocolate

        • Vanilla

        • Mint

        • Nuts

        • Caramel

        • Blends

      • REST OF EUROPE Flavoured Syrups by Category

        • Conventional

        • Organic

      • REST OF EUROPE Flavoured Syrups by Distribution Channel

        • Food Service

        • Food Rental

    • Asia-Pacific Outlook (USD Billion, 2018-2032)

      • Asia-Pacific Flavoured Syrups by Flavoured Type

        • Fruits

        • Coffee

        • Chocolate

        • Vanilla

        • Mint

        • Nuts

        • Caramel

        • Blends

      • Asia-Pacific Flavoured Syrups by Category

        • Conventional

        • Organic

      • Asia-Pacific Flavoured Syrups by Distribution Channel

        • Food Service

        • Food Rental

      • China Outlook (USD Billion, 2018-2032)

      • China Flavoured Syrups by Flavoured Type

        • Fruits

        • Coffee

        • Chocolate

        • Vanilla

        • Mint

        • Nuts

        • Caramel

        • Blends

      • China Flavoured Syrups by Category

        • Conventional

        • Organic

      • China Flavoured Syrups by Distribution Channel

        • Food Service

        • Food Rental

      • Japan Outlook (USD Billion, 2018-2032)

      • Japan Flavoured Syrups by Flavoured Type

        • Fruits

        • Coffee

        • Chocolate

        • Vanilla

        • Mint

        • Nuts

        • Caramel

        • Blends

      • Japan Flavoured Syrups by Category

        • Conventional

        • Organic

      • Japan Flavoured Syrups by Distribution Channel

        • Food Service

        • Food Rental

      • India Outlook (USD Billion, 2018-2032)

      • India Flavoured Syrups by Flavoured Type

        • Food

        • Beverages

        • Supplements

      • India Flavoured Syrups by Distribution Channel

        • Food Service

        • Food Rental

      • Australia Outlook (USD Billion, 2018-2032)

      • Australia Flavoured Syrups by Flavoured Type

        • Fruits

        • Coffee

        • Chocolate

        • Vanilla

        • Mint

        • Nuts

        • Caramel

        • Blends

      • Australia Flavoured Syrups by Category

        • Conventional

        • Organic

      • Australia Flavoured Syrups by Distribution Channel

        • Food Service

        • Food Rental

      • Rest of Asia-Pacific Outlook (USD Billion, 2018-2032)

      • Rest of Asia-Pacific Flavoured Syrups by Flavoured Type

        • Fruits

        • Coffee

        • Chocolate

        • Vanilla

        • Mint

        • Nuts

        • Caramel

        • Blends

      • Rest of Asia Pacific Flavoured Syrups by Category

        • Conventional

        • Organic

      • Rest of Asia-Pacific Flavoured Syrups by Distribution Channel

        • Food Service

        • Food Rental

    • Rest of the World Outlook (USD Billion, 2018-2032)

      • Rest of the World Flavoured Syrups by Flavoured Type

        • Fruits

        • Coffee

        • Chocolate

        • Vanilla

        • Mint

        • Nuts

        • Caramel

        • Blends

      • Rest of the World Flavoured Syrups by Category

        • Conventional

        • Organic

      • Rest of the World Flavoured Syrups by Distribution Channel

        • Food Service

        • Food Rental

      • Middle East Outlook (USD Billion, 2018-2032)

      • Middle East Flavoured Syrups by Flavoured Type

        • Fruits

        • Coffee

        • Chocolate

        • Vanilla

        • Mint

        • Nuts

        • Caramel

        • Blends

      • Middle East Flavoured Syrups by Category

        • Conventional

        • Organic

      • Middle East Flavoured Syrups by Distribution Channel

        • Food Service

        • Food Rental

      • Africa Outlook (USD Billion, 2018-2032)

      • Africa Flavoured Syrups by Flavoured Type

        • Fruits

        • Coffee

        • Chocolate

        • Vanilla

        • Mint

        • Nuts

        • Caramel

        • Blends

      • Africa Flavoured Syrups by Category

        • Conventional

        • Organic

      • Africa Flavoured Syrups by Distribution Channel

        • Food Service

        • Food Rental

      • Latin America Outlook (USD Billion, 2018-2032)

      • Latin America Flavoured Syrups by Flavoured Type

        • Fruits

        • Coffee

        • Chocolate

        • Vanilla

        • Mint

        • Nuts

        • Caramel

        • Blends

      • Latin America Flavoured Syrups by Category

        • Conventional

        • Organic

      • Latin America Flavoured Syrups by Distribution Channel

        • Food Service

        • Food Rental

    Infographic

    Free Sample Request

    Kindly complete the form below to receive a free sample of this Report

    Get Free Sample

    Customer Strories

    “I am very pleased with how market segments have been defined in a relevant way for my purposes (such as "Portable Freezers & refrigerators" and "last-mile"). In general the report is well structured. Thanks very much for your efforts.”

    Victoria Milne

    Founder
    Case Study
    Chemicals and Materials

    Compare Licence

    ×
    Features License Type
    Single User Multiuser License Enterprise User
    Price $4,950 $5,950 $7,250
    Maximum User Access Limit 1 User Upto 10 Users Unrestricted Access Throughout the Organization
    Free Customization
    Direct Access to Analyst
    Deliverable Format
    Platform Access
    Discount on Next Purchase 10% 15% 15%
    Printable Versions