Facial Injectable Market (2026 - 2035)

ID: MRFR/MED/0998-CR 104 Pages Nidhi Mandole Last Updated: September 15, 2026
Facial Injectable Market Research Report Information By Application (Facial Line Correction Treatment, Face Lift, and Lip Treatments), By End User (Hospitals and Specialty Clinics and Spa & Beauty Clinic), By Type (Botulinum Toxin, Hyaluronic Acid, Polymers, and Particles and Collagen), And By Region (North America, Europe, Asia-Pacific, And Rest Of The World) - Growth & Industry Forecast 2025 To 2035
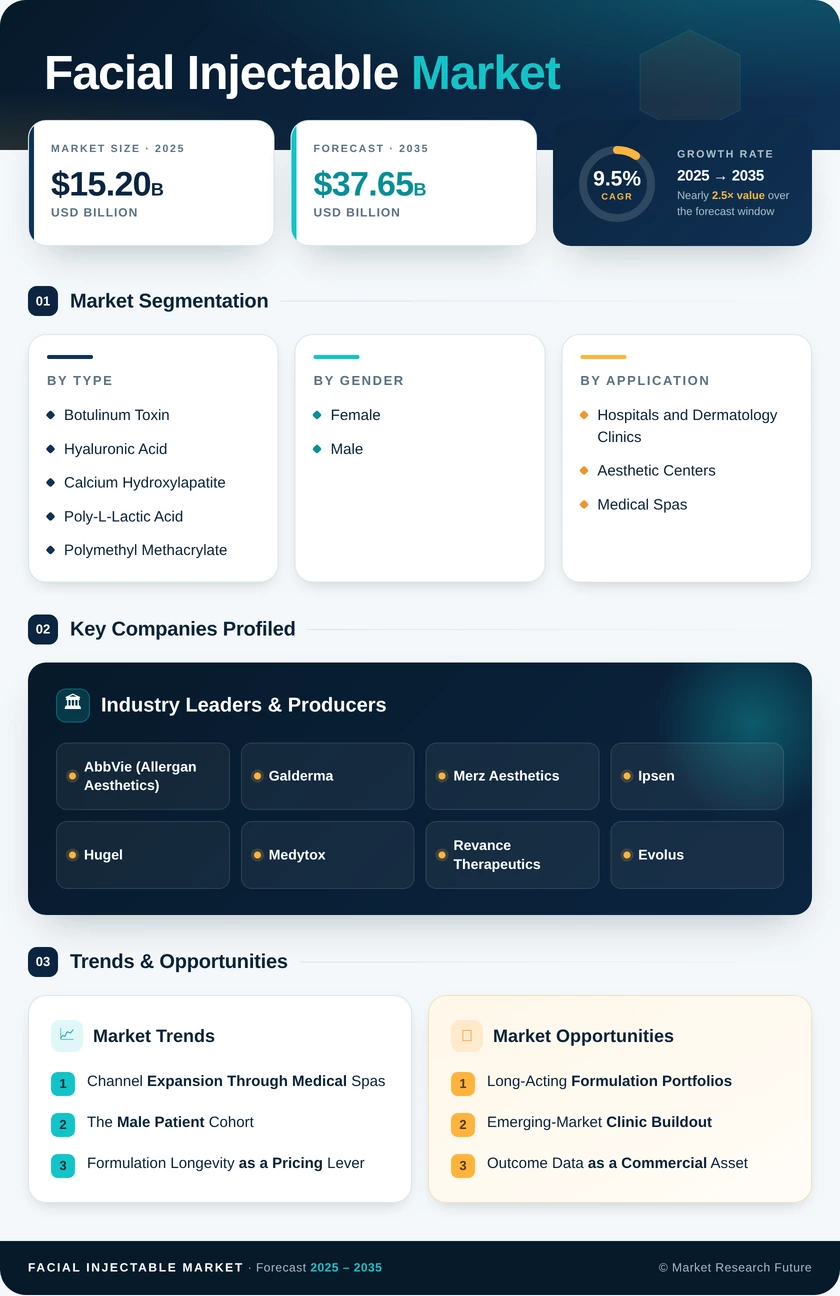
Facial Injectable Market
Market Size
Forecast Period2026-2035
CAGR (2026-2035)9.5%
2025 Market SizeUSD 15.20 Billion
2035 Market SizeUSD 37.65 Billion
Key Players
AbbVie
Galderma
Merz Aesthetics
Ipsen
Hugel
Medytox
Opportunities
  • Long-Acting Formulation Portfolios
  • Emerging-Market Clinic Buildout
  • Outcome Data as a Commercial Asset
  1. 1 Market Overview |
    1. 1.1 Study Assumptions & Market Definition |
    2. 1.2 Scope of the Study |
    3. 1.3 Research Methodology
  2. 2 Market Summary & Key Takeaways |
    1. 2.1 Key Findings by Product Type |
    2. 2.2 Key Findings by Gender |
    3. 2.3 Key Findings by Application |
    4. 2.4 Key Findings by End User |
    5. 2.5 Key Findings by Geography
  3. 3 Market Size & Forecast (2021–2035) |
    1. 3.1 Historical Market Size (2021–2025) |
    2. 3.2 Current & Forecast Market Size (2026–2035) |
    3. 3.3 Market Size by Revenue (USD Billion) |
    4. 3.4 Year-over-Year Growth Analysis
  4. 4 Market Drivers Analysis |
    1. 4.1 Channel Expansion Through Medical Spas |
    2. 4.2 The Male Patient Cohort |
    3. 4.3 Formulation Longevity as a Pricing Lever |
    4. 4.4 Computational Treatment Planning
  5. 5 Market Restraints Analysis |
    1. 5.1 Enforcement and Compliance Cost |
    2. 5.2 Biosimilar Price Pressure |
    3. 5.3 Counterfeit Supply Chains
  6. 6 Market Opportunity Analysis |
    1. 6.1 Long-Acting Formulation Portfolios |
    2. 6.2 Emerging-Market Clinic Buildout |
    3. 6.3 Outcome Data as a Commercial Asset |
    4. 6.4 Therapeutic Indication Crossover |
    5. 6.5 Male-Specific Product Positioning |
    6. 6.6 Industry Value Chain Analysis |
    7. 6.7 Porter's Five Forces Analysis
  7. 7 Regional Analysis |
    1. 7.1 North America | |
      1. 7.1.1 US | |
      2. 7.1.2 Canada | |
      3. 7.1.3 Mexico |
    2. 7.2 Europe | |
      1. 7.2.1 Germany | |
      2. 7.2.2 UK | |
      3. 7.2.3 France | |
      4. 7.2.4 Italy | |
      5. 7.2.5 Spain | |
      6. 7.2.6 Nordic Countries | |
      7. 7.2.7 Russia | |
      8. 7.2.8 Rest of Europe |
    3. 7.3 Asia-Pacific | |
      1. 7.3.1 China | |
      2. 7.3.2 India | |
      3. 7.3.3 Japan | |
      4. 7.3.4 South Korea | |
      5. 7.3.5 ASEAN | |
      6. 7.3.6 Rest of Asia-Pacific |
    4. 7.4 South America | |
      1. 7.4.1 Brazil | |
      2. 7.4.2 Argentina | |
      3. 7.4.3 Rest of South America |
    5. 7.5 Middle East & Africa | |
      1. 7.5.1 Saudi Arabia | |
      2. 7.5.2 UAE | |
      3. 7.5.3 South Africa | |
      4. 7.5.4 Egypt | |
      5. 7.5.5 Rest of Middle East & Africa
  8. 8 Future Outlook (2026–2035) |
    1. 8.1 Computational Aesthetics Becomes Standard of Care |
    2. 8.2 Subscription Economics Replace Transactions |
    3. 8.3 Manufacturing Decentralisation |
    4. 8.4 Safety Infrastructure and Traceability
  9. 9 Segmentation Analysis |
    1. 9.1 By Product Type | |
      1. 9.1.1 Botulinum Toxin | |
      2. 9.1.2 Hyaluronic Acid | |
      3. 9.1.3 Calcium Hydroxylapatite | |
      4. 9.1.4 Poly-L-Lactic Acid | |
      5. 9.1.5 Polymethyl Methacrylate | |
      6. 9.1.6 Others |
    2. 9.2 By Gender | |
      1. 9.2.1 Female | |
      2. 9.2.2 Male |
    3. 9.3 By Application | |
      1. 9.3.1 Wrinkle Reduction and Anti-Aging | |
      2. 9.3.2 Lip Augmentation | |
      3. 9.3.3 Face Lift | |
      4. 9.3.4 Scar and Acne-Scar Treatment | |
      5. 9.3.5 Lipoatrophy | |
      6. 9.3.6 Others |
    4. 9.4 By End User | |
      1. 9.4.1 Hospitals and Dermatology Clinics | |
      2. 9.4.2 Aesthetic Centers | |
      3. 9.4.3 Medical Spas
  10. 10 Competitive Landscape |
    1. 10.1 Market Share Analysis (2026) |
    2. 10.2 Competitive Benchmarking Matrix |
    3. 10.3 Company Profiles | |
      1. 10.3.1 AbbVie (Allergan Aesthetics) | |
      2. 10.3.2 Galderma | |
      3. 10.3.3 Merz Aesthetics | |
      4. 10.3.4 Ipsen | |
      5. 10.3.5 Hugel | |
      6. 10.3.6 Medytox | |
      7. 10.3.7 Revance Therapeutics | |
      8. 10.3.8 Evolus | |
      9. 10.3.9 LG Chem | |
      10. 10.3.10 Sinclair (Huadong Medicine) | |
      11. 10.3.11 Teoxane | |
      12. 10.3.12 Prollenium Medical
  11. 11 Recent Developments & News
  12. 12 Report Scope & Methodology |
    1. 12.1 Study Period & Base Year |
    2. 12.2 Data Sources & Citations |
    3. 12.3 Abbreviations
  13. 13 Detailed Sources and Citations
  14. 14 Frequently Asked Questions (FAQs)
  15. 15 LIST OF TABLES |
  16. TABLE 1 Global Facial Injectable Market Size & Forecast, by Revenue (USD Billion), 2021–2035 |
  17. TABLE 2 Global Facial Injectable Market – Year-over-Year Growth Analysis, 2021–2035 |
  18. TABLE 3 Driver Impact Analysis – Global Facial Injectable Market, 2026–2035 |
  19. TABLE 4 Restraint Impact Analysis – Global Facial Injectable Market, 2026–2035 |
  20. TABLE 5 Global Facial Injectable Market Size, by Product Type, 2021–2035 (USD Billion) |
  21. TABLE 6 Global Facial Injectable Market Size, by Gender, 2021–2035 (USD Billion) |
  22. TABLE 7 Global Facial Injectable Market Size, by Application, 2021–2035 (USD Billion) |
  23. TABLE 8 Global Facial Injectable Market Size, by End User, 2021–2035 (USD Billion) |
  24. TABLE 9 Global Facial Injectable Market Size, by Region, 2021–2035 (USD Billion) |
  25. TABLE 10 North America Facial Injectable Market Size, by Country, 2021–2035 (USD Billion) |
  26. TABLE 11 Europe Facial Injectable Market Size, by Country, 2021–2035 (USD Billion) |
  27. TABLE 12 Asia-Pacific Facial Injectable Market Size, by Country, 2021–2035 (USD Billion) |
  28. TABLE 13 South America Facial Injectable Market Size, by Country, 2021–2035 (USD Billion) |
  29. TABLE 14 Middle East & Africa Facial Injectable Market Size, by Country, 2021–2035 (USD Billion) |
  30. TABLE 15 North America Facial Injectable Market Size, by Product Type, 2021–2035 (USD Billion) |
  31. TABLE 16 North America Facial Injectable Market Size, by Application, 2021–2035 (USD Billion) |
  32. TABLE 17 North America Facial Injectable Market Size, by End User, 2021–2035 (USD Billion) |
  33. TABLE 18 Europe Facial Injectable Market Size, by Product Type, 2021–2035 (USD Billion) |
  34. TABLE 19 Europe Facial Injectable Market Size, by Application, 2021–2035 (USD Billion) |
  35. TABLE 20 Europe Facial Injectable Market Size, by End User, 2021–2035 (USD Billion) |
  36. TABLE 21 Asia-Pacific Facial Injectable Market Size, by Product Type, 2021–2035 (USD Billion) |
  37. TABLE 22 Asia-Pacific Facial Injectable Market Size, by Application, 2021–2035 (USD Billion) |
  38. TABLE 23 Asia-Pacific Facial Injectable Market Size, by End User, 2021–2035 (USD Billion) |
  39. TABLE 24 South America Facial Injectable Market Size, by Product Type, 2021–2035 (USD Billion) |
  40. TABLE 25 South America Facial Injectable Market Size, by Application, 2021–2035 (USD Billion) |
  41. TABLE 26 Middle East & Africa Facial Injectable Market Size, by Product Type, 2021–2035 (USD Billion) |
  42. TABLE 27 Middle East & Africa Facial Injectable Market Size, by Application, 2021–2035 (USD Billion) |
  43. TABLE 28 US Facial Injectable Market Size, by Product Type, 2021–2035 (USD Billion) |
  44. TABLE 29 Germany Facial Injectable Market Size, by Product Type, 2021–2035 (USD Billion) |
  45. TABLE 30 China Facial Injectable Market Size, by Product Type, 2021–2035 (USD Billion) |
  46. TABLE 31 South Korea Facial Injectable Market Size, by Product Type, 2021–2035 (USD Billion) |
  47. TABLE 32 Brazil Facial Injectable Market Size, by Product Type, 2021–2035 (USD Billion) |
  48. TABLE 33 Competitive Benchmarking Matrix – Global Facial Injectable Market, 2026 |
  49. TABLE 34 Company Profiles – Key Players, Global Facial Injectable Market |
  50. TABLE 35 Recent Developments & Strategic Announcements, 2023–2025 |
  51. TABLE 36 Report Scope & Methodology Summary |
  52. TABLE 37 Detailed Sources and Citations Index
  53. 16 LIST OF FIGURES |
  54. FIGURE 1 Global Facial Injectable Market – Market Dynamics Overview (Drivers, Restraints, Opportunities) |
  55. FIGURE 2 Global Facial Injectable Market – Industry Value Chain Analysis |
  56. FIGURE 3 Global Facial Injectable Market – Porter's Five Forces Analysis |
  57. FIGURE 4 Global Facial Injectable Market Size Trend, 2021–2035 (USD Billion) |
  58. FIGURE 5 Global Facial Injectable Market – Year-over-Year Growth Trend, 2022–2035 (%) |
  59. FIGURE 6 Market Share by Product Type, 2025 vs 2035 (%) |
  60. FIGURE 7 Market Share by Gender, 2025 vs 2035 (%) |
  61. FIGURE 8 Market Share by Application, 2025 (%) |
  62. FIGURE 9 Market Share by End User, 2025 (%) |
  63. FIGURE 10 Regional Revenue Share, 2025 (%) |
  64. FIGURE 11 Regional CAGR Comparison, 2026–2035 (%) |
  65. FIGURE 12 North America Country-Level Share, 2025 (%) |
  66. FIGURE 13 Europe Country-Level Share, 2025 (%) |
  67. FIGURE 14 Asia-Pacific Country-Level Share, 2025 (%) |
  68. FIGURE 15 Competitive Landscape – Estimated Revenue Share Ranges, 2026 |
  69. FIGURE 16 Competitive Positioning Matrix – Portfolio Breadth vs Geographic Reach |
  70. FIGURE 17 Driver Impact Contribution by Timeline Horizon |
  71. FIGURE 18 Future Outlook Scenario Bands, 2026–2035 (USD Billion)

Segmentation Quick Reference

DimensionSub-SegmentsDominant SegmentFastest Growing Segment
By Product TypeBotulinum Toxin; Hyaluronic Acid; Calcium Hydroxylapatite; Poly-L-Lactic Acid; Polymethyl Methacrylate; OthersBotulinum ToxinPoly-L-Lactic Acid
By GenderFemale; MaleFemaleMale
By ApplicationWrinkle Reduction and Anti-Aging; Lip Augmentation; Face Lift; Scar and Acne-Scar Treatment; Lipoatrophy; OthersWrinkle Reduction and Anti-AgingScar and Acne-Scar Treatment
By End UserHospitals and Dermatology Clinics; Aesthetic Centers; Medical SpasHospitals and Dermatology ClinicsMedical Spas
By GeographyNorth America; Europe; Asia-Pacific; South America; Middle East & AfricaNorth AmericaAsia-Pacific


Market Segmentation Overview

By Product Type

Sub-SegmentKey Trend
Botulinum ToxinExtended-duration formulations shifting visit cadence and per-treatment pricing
Hyaluronic AcidRheology-tuned product families targeting distinct anatomical zones
Calcium HydroxylapatiteGrowing use as a diluted biostimulator for skin quality rather than volume
Poly-L-Lactic AcidPre-hydrated suspensions cutting preparation time and improving consistency.
Polymethyl MethacrylateNarrow but stable niche in long-duration structural correction
OthersAutologous preparations and combination protocols gaining clinical evidence


Product strategy is converging on portfolio completeness. Suppliers that carry toxin, a full filler range and at least one biostimulator capture the entire treatment plan, which is why single-product specialists increasingly seek licensing partnerships rather than defending isolated positions.

By Gender

Sub-SegmentKey Trend
FemaleBroadening age range, with growth strongest above 55 and below 30
MaleFunctional framing — jawline, masseter, hyperhidrosis — outpacing cosmetic messaging


Female patients remain the volume base and set clinic economics. However, male adoption is the more interesting operational story: higher unit consumption per treatment, lower price sensitivity, and referral patterns that run through workplace and sports networks rather than social media.

By Application

Sub-SegmentKey Trend
Wrinkle Reduction and Anti-AgingPreventive treatment among under-30 patients extending the demand curve
Lip AugmentationShift toward conservative volumes and reversible products.
Face LiftThread and filler combination protocols substituting for early surgical intervention
Scar and Acne-Scar TreatmentDermatology referral pathways building clinical legitimacy
LipoatrophySteady demand from HIV-related and age-related fat-pad loss
OthersHyperhidrosis and bruxism protocols crossing into reimbursed territory


Application mix is broadening away from pure anti-aging. Treatments with a clinical rather than cosmetic rationale carry better retention and open reimbursement conversations, which is why manufacturers fund trials in adjacent indications even where cosmetic demand alone would justify the product.

By End User

Sub-SegmentKey Trend
Hospitals and Dermatology ClinicsComplication management and therapeutic crossover anchoring share
Aesthetic CentersSpecialist practitioner concentration supporting premium pricing
Medical SpasRetail formats, membership pricing and walk-in scheduling driving fastest growth


Channel economics diverge sharply. Clinical settings hold pricing power and referral flow; retail formats win on convenience and volume. Consolidation is running hardest in the middle tier, where single-site aesthetic centers lack both the clinical credential and the retail scale to defend margin.

By Geography

Sub-SegmentKey Trend
North AmericaChain consolidation accelerating under rising compliance costs
EuropeDevice regulation reshaping filler SKU availability and supplier mix
Asia-PacificDomestic manufacturing scale compressing landed cost across the region
South AmericaBrazilian clinic formalisation and currency-driven tourism flows
Middle East & AfricaGulf licensing liberalisation drawing regional and international patients


Regional divergence is widening rather than converging. Compliance burden defines Western market structure, manufacturing cost defines Asia-Pacific, and licensing policy defines the Gulf — three different levers that reward quite different commercial strategies.




Download PDF ×

We do not share your information with anyone. However, we may send you emails based on your report interest from time to time. You may contact us at any time to opt-out.