Healthcare Market Segmentation
Healthcare By Application (USD Billion, 2025-2035)
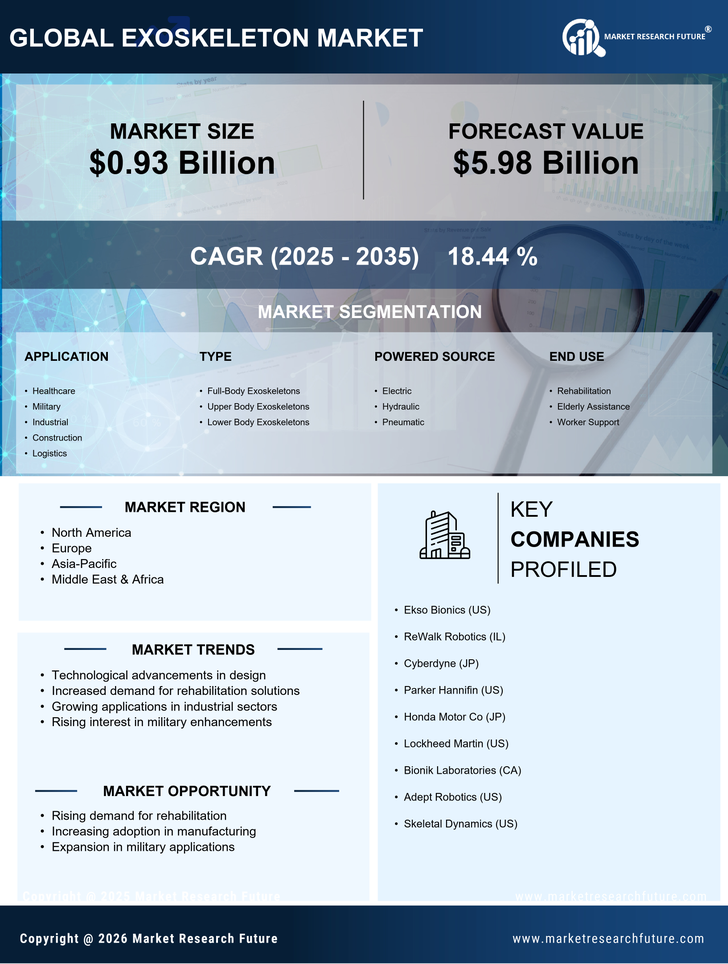
- Healthcare
- Military
- Industrial
- Construction
- Logistics
Healthcare By Type (USD Billion, 2025-2035)
- Full-Body Exoskeletons
- Upper Body Exoskeletons
- Lower Body Exoskeletons
Healthcare By Powered Source (USD Billion, 2025-2035)
- Electric
- Hydraulic
- Pneumatic
Healthcare By End Use (USD Billion, 2025-2035)
- Rehabilitation
- Elderly Assistance
- Worker Support