Request Free Sample ×

Kindly complete the form below to receive a free sample of this Report

* Please use a valid business email

Leading companies partner with us for data-driven Insights

clients tt-cursor
Hero Background

Europe Smart Solar Market

ID: MRFR/EnP/20034-HCR
128 Pages
Chitranshi Jaiswal
Last Updated: April 06, 2026

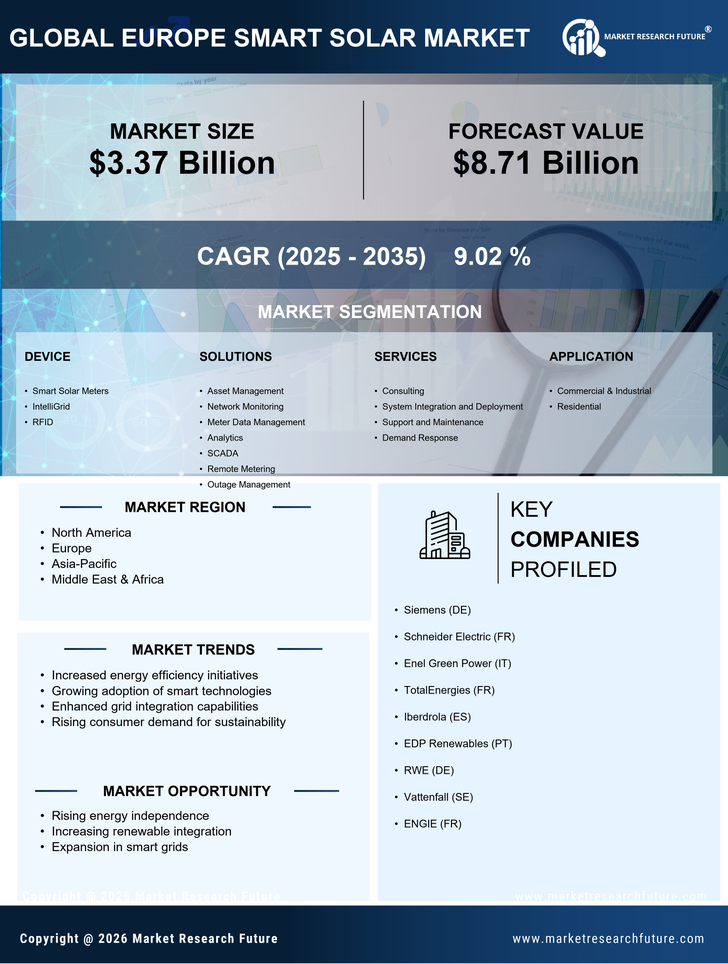
Europe Smart Solar Market Research Report Information By Device (Smart Solar Meters, IntelliGrid, RFID), By Solutions (Asset Management, Network Monitoring, Meter Data Management, Analytics, SCADA, Remote Metering, Outage Management), By Services (Consulting, System Integration and Deployment, Support and Maintenance, Demand Response), By Application (Commercial & Industrial, Residential), By Industrial Sector (Government, Utilities, Healthcare, Construction, Education, Agriculture, and Others) –and Europe Market Forecast Till 2035

Share:
Download PDF ×

We do not share your information with anyone. However, we may send you emails based on your report interest from time to time. You may contact us at any time to opt-out.

Europe Smart Solar Market Infographic
Purchase Options
  1. 1 SECTION I: EXECUTIVE SUMMARY AND KEY HIGHLIGHTS
  2.   1.1 EXECUTIVE SUMMARY
  3.     1.1.1 Market Overview
  4.     1.1.2 Key Findings
  5.     1.1.3 Market Segmentation
  6.     1.1.4 Competitive Landscape
  7.     1.1.5 Challenges and Opportunities
  8.     1.1.6 Future Outlook
  9. 2 SECTION II: SCOPING, METHODOLOGY AND MARKET STRUCTURE
  10.   2.1 MARKET INTRODUCTION
  11.     2.1.1 Definition
  12.     2.1.2 Scope of the study
  13.       2.1.2.1 Research Objective
  14.       2.1.2.2 Assumption
  15.       2.1.2.3 Limitations
  16.   2.2 RESEARCH METHODOLOGY
  17.     2.2.1 Overview
  18.     2.2.2 Data Mining
  19.     2.2.3 Secondary Research
  20.     2.2.4 Primary Research
  21.       2.2.4.1 Primary Interviews and Information Gathering Process
  22.       2.2.4.2 Breakdown of Primary Respondents
  23.     2.2.5 Forecasting Model
  24.     2.2.6 Market Size Estimation
  25.       2.2.6.1 Bottom-Up Approach
  26.       2.2.6.2 Top-Down Approach
  27.     2.2.7 Data Triangulation
  28.     2.2.8 Validation
  29. 3 SECTION III: QUALITATIVE ANALYSIS
  30.   3.1 MARKET DYNAMICS
  31.     3.1.1 Overview
  32.     3.1.2 Drivers
  33.     3.1.3 Restraints
  34.     3.1.4 Opportunities
  35.   3.2 MARKET FACTOR ANALYSIS
  36.     3.2.1 Value chain Analysis
  37.     3.2.2 Porter's Five Forces Analysis
  38.       3.2.2.1 Bargaining Power of Suppliers
  39.       3.2.2.2 Bargaining Power of Buyers
  40.       3.2.2.3 Threat of New Entrants
  41.       3.2.2.4 Threat of Substitutes
  42.       3.2.2.5 Intensity of Rivalry
  43.     3.2.3 COVID-19 Impact Analysis
  44.       3.2.3.1 Market Impact Analysis
  45.       3.2.3.2 Regional Impact
  46.       3.2.3.3 Opportunity and Threat Analysis
  47. 4 SECTION IV: QUANTITATIVE ANALYSIS
  48.   4.1 Energy & Power, BY Application (USD Billion)
  49.     4.1.1 Residential
  50.     4.1.2 Commercial
  51.     4.1.3 Industrial
  52.     4.1.4 Utility
  53.     4.1.5 Agricultural
  54.   4.2 Energy & Power, BY Technology (USD Billion)
  55.     4.2.1 Photovoltaic
  56.     4.2.2 Concentrated Solar Power
  57.     4.2.3 Building Integrated Photovoltaics
  58.     4.2.4 Solar Thermal
  59.     4.2.5 Hybrid Systems
  60.   4.3 Energy & Power, BY End Use (USD Billion)
  61.     4.3.1 Energy Generation
  62.     4.3.2 Energy Storage
  63.     4.3.3 Grid Management
  64.     4.3.4 Electric Vehicle Charging
  65.     4.3.5 Heating Solutions
  66.   4.4 Energy & Power, BY Installation Type (USD Billion)
  67.     4.4.1 Rooftop
  68.     4.4.2 Ground-mounted
  69.     4.4.3 Floating
  70.     4.4.4 Building-integrated
  71.     4.4.5 Off-grid
  72.   4.5 Energy & Power, BY System Size (USD Billion)
  73.     4.5.1 Small Scale
  74.     4.5.2 Medium Scale
  75.     4.5.3 Large Scale
  76.     4.5.4 Utility Scale
  77.     4.5.5 Microgrid
  78. 5 SECTION V: COMPETITIVE ANALYSIS
  79.   5.1 Competitive Landscape
  80.     5.1.1 Overview
  81.     5.1.2 Competitive Analysis
  82.     5.1.3 Market share Analysis
  83.     5.1.4 Major Growth Strategy in the Energy & Power
  84.     5.1.5 Competitive Benchmarking
  85.     5.1.6 Leading Players in Terms of Number of Developments in the Energy & Power
  86.     5.1.7 Key developments and growth strategies
  87.       5.1.7.1 New Product Launch/Service Deployment
  88.       5.1.7.2 Merger & Acquisitions
  89.       5.1.7.3 Joint Ventures
  90.     5.1.8 Major Players Financial Matrix
  91.       5.1.8.1 Sales and Operating Income
  92.       5.1.8.2 Major Players R&D Expenditure. 2023
  93.   5.2 Company Profiles
  94.     5.2.1 SMA Solar Technology AG (DE)
  95.       5.2.1.1 Financial Overview
  96.       5.2.1.2 Products Offered
  97.       5.2.1.3 Key Developments
  98.       5.2.1.4 SWOT Analysis
  99.       5.2.1.5 Key Strategies
  100.     5.2.2 Enphase Energy Inc (US)
  101.       5.2.2.1 Financial Overview
  102.       5.2.2.2 Products Offered
  103.       5.2.2.3 Key Developments
  104.       5.2.2.4 SWOT Analysis
  105.       5.2.2.5 Key Strategies
  106.     5.2.3 SolarEdge Technologies Inc (IL)
  107.       5.2.3.1 Financial Overview
  108.       5.2.3.2 Products Offered
  109.       5.2.3.3 Key Developments
  110.       5.2.3.4 SWOT Analysis
  111.       5.2.3.5 Key Strategies
  112.     5.2.4 Fronius International GmbH (AT)
  113.       5.2.4.1 Financial Overview
  114.       5.2.4.2 Products Offered
  115.       5.2.4.3 Key Developments
  116.       5.2.4.4 SWOT Analysis
  117.       5.2.4.5 Key Strategies
  118.     5.2.5 Trina Solar Limited (CN)
  119.       5.2.5.1 Financial Overview
  120.       5.2.5.2 Products Offered
  121.       5.2.5.3 Key Developments
  122.       5.2.5.4 SWOT Analysis
  123.       5.2.5.5 Key Strategies
  124.     5.2.6 Canadian Solar Inc (CA)
  125.       5.2.6.1 Financial Overview
  126.       5.2.6.2 Products Offered
  127.       5.2.6.3 Key Developments
  128.       5.2.6.4 SWOT Analysis
  129.       5.2.6.5 Key Strategies
  130.     5.2.7 JinkoSolar Holding Co Ltd (CN)
  131.       5.2.7.1 Financial Overview
  132.       5.2.7.2 Products Offered
  133.       5.2.7.3 Key Developments
  134.       5.2.7.4 SWOT Analysis
  135.       5.2.7.5 Key Strategies
  136.     5.2.8 First Solar Inc (US)
  137.       5.2.8.1 Financial Overview
  138.       5.2.8.2 Products Offered
  139.       5.2.8.3 Key Developments
  140.       5.2.8.4 SWOT Analysis
  141.       5.2.8.5 Key Strategies
  142.   5.3 Appendix
  143.     5.3.1 References
  144.     5.3.2 Related Reports
  145. 6 LIST OF FIGURES
  146.   6.1 MARKET SYNOPSIS
  147.   6.2 EUROPE MARKET ANALYSIS BY APPLICATION
  148.   6.3 EUROPE MARKET ANALYSIS BY TECHNOLOGY
  149.   6.4 EUROPE MARKET ANALYSIS BY END USE
  150.   6.5 EUROPE MARKET ANALYSIS BY INSTALLATION TYPE
  151.   6.6 EUROPE MARKET ANALYSIS BY SYSTEM SIZE
  152.   6.7 KEY BUYING CRITERIA OF ENERGY & POWER
  153.   6.8 RESEARCH PROCESS OF MRFR
  154.   6.9 DRO ANALYSIS OF ENERGY & POWER
  155.   6.10 DRIVERS IMPACT ANALYSIS: ENERGY & POWER
  156.   6.11 RESTRAINTS IMPACT ANALYSIS: ENERGY & POWER
  157.   6.12 SUPPLY / VALUE CHAIN: ENERGY & POWER
  158.   6.13 ENERGY & POWER, BY APPLICATION, 2024 (% SHARE)
  159.   6.14 ENERGY & POWER, BY APPLICATION, 2024 TO 2035 (USD Billion)
  160.   6.15 ENERGY & POWER, BY TECHNOLOGY, 2024 (% SHARE)
  161.   6.16 ENERGY & POWER, BY TECHNOLOGY, 2024 TO 2035 (USD Billion)
  162.   6.17 ENERGY & POWER, BY END USE, 2024 (% SHARE)
  163.   6.18 ENERGY & POWER, BY END USE, 2024 TO 2035 (USD Billion)
  164.   6.19 ENERGY & POWER, BY INSTALLATION TYPE, 2024 (% SHARE)
  165.   6.20 ENERGY & POWER, BY INSTALLATION TYPE, 2024 TO 2035 (USD Billion)
  166.   6.21 ENERGY & POWER, BY SYSTEM SIZE, 2024 (% SHARE)
  167.   6.22 ENERGY & POWER, BY SYSTEM SIZE, 2024 TO 2035 (USD Billion)
  168.   6.23 BENCHMARKING OF MAJOR COMPETITORS
  169. 7 LIST OF TABLES
  170.   7.1 LIST OF ASSUMPTIONS
  171.     7.1.1
  172.   7.2 Europe MARKET SIZE ESTIMATES; FORECAST
  173.     7.2.1 BY APPLICATION, 2026-2035 (USD Billion)
  174.     7.2.2 BY TECHNOLOGY, 2026-2035 (USD Billion)
  175.     7.2.3 BY END USE, 2026-2035 (USD Billion)
  176.     7.2.4 BY INSTALLATION TYPE, 2026-2035 (USD Billion)
  177.     7.2.5 BY SYSTEM SIZE, 2026-2035 (USD Billion)
  178.   7.3 PRODUCT LAUNCH/PRODUCT DEVELOPMENT/APPROVAL
  179.     7.3.1
  180.   7.4 ACQUISITION/PARTNERSHIP
  181.     7.4.1

Europe Energy & Power Market Segmentation

Energy & Power By Application (USD Billion, 2022-2035)

  • Residential
  • Commercial
  • Industrial
  • Utility
  • Agricultural

Energy & Power By Technology (USD Billion, 2022-2035)

  • Photovoltaic
  • Concentrated Solar Power
  • Building Integrated Photovoltaics
  • Solar Thermal
  • Hybrid Systems

Energy & Power By End Use (USD Billion, 2022-2035)

  • Energy Generation
  • Energy Storage
  • Grid Management
  • Electric Vehicle Charging
  • Heating Solutions

Energy & Power By Installation Type (USD Billion, 2022-2035)

  • Rooftop
  • Ground-mounted
  • Floating
  • Building-integrated
  • Off-grid

Energy & Power By System Size (USD Billion, 2022-2035)

  • Small Scale
  • Medium Scale
  • Large Scale
  • Utility Scale
  • Microgrid

Compare Licence

×
Features License Type
Single User Multiuser License Enterprise User
Price $4,950 $5,950 $7,250
Maximum User Access Limit 1 User Upto 10 Users Unrestricted Access Throughout the Organization
Free Customization
Direct Access to Analyst
Deliverable Format
Platform Access
Discount on Next Purchase 10% 15% 15%
Printable Versions