Request Free Sample ×

Kindly complete the form below to receive a free sample of this Report

* Please use a valid business email

Leading companies partner with us for data-driven Insights

clients tt-cursor
Hero Background

Europe Open Source Intelligence Market

ID: MRFR/ICT/44322-HCR
200 Pages
Aarti Dhapte
December 2024

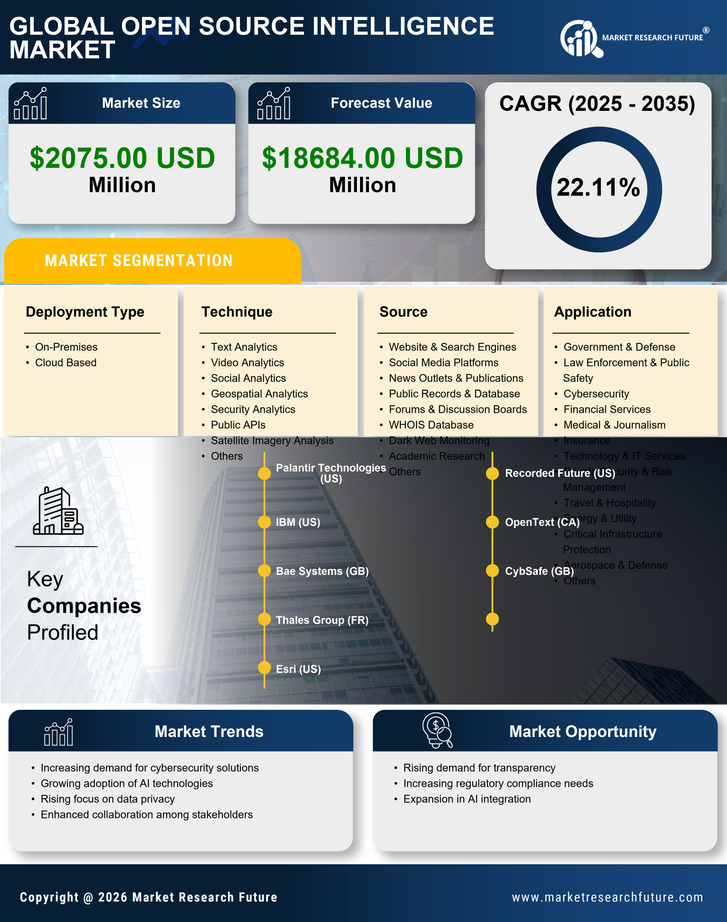
Europe Open Source Intelligence (OSINT) Market Size, Share and Trends Analysis Report By Technique (Text Analytics, Video Analytics, Social Analytics, Geospatial Analytics, Security Analytics, Public APIs, Satellite Imagery Analysis, Others), By Source (Website Search Engines, Social Media Platforms, News Outlets Publications, Public Records Database, Forums Discussion Boards, WHOIS Database, Dark Web Monitoring, Academic Research, Others), By Deployment Type (On-premises, Cloud), By Organization Size (SME’s, Large Enterprises) and By Application (Government Defense, Law Enforcement Public Safety, Cybersecurity, Financial Services, Medical Journalism, Insurance, Technology IT Services, Private Security Risk Management, Travel Hospitality, Energy Utility, Critical Infrastructure Protection, Aerospace Defense, Others) - Forecast to 2035

Share:
Download PDF ×

We do not share your information with anyone. However, we may send you emails based on your report interest from time to time. You may contact us at any time to opt-out.

Europe Open Source Intelligence Market Infographic
Purchase Options
  1. 1 SECTION I: EXECUTIVE SUMMARY AND KEY HIGHLIGHTS
  2.   1.1 EXECUTIVE SUMMARY
  3.     1.1.1 Market Overview
  4.     1.1.2 Key Findings
  5.     1.1.3 Market Segmentation
  6.     1.1.4 Competitive Landscape
  7.     1.1.5 Challenges and Opportunities
  8.     1.1.6 Future Outlook
  9. 2 SECTION II: SCOPING, METHODOLOGY AND MARKET STRUCTURE
  10.   2.1 MARKET INTRODUCTION
  11.     2.1.1 Definition
  12.     2.1.2 Scope of the study
  13.       2.1.2.1 Research Objective
  14.       2.1.2.2 Assumption
  15.       2.1.2.3 Limitations
  16.   2.2 RESEARCH METHODOLOGY
  17.     2.2.1 Overview
  18.     2.2.2 Data Mining
  19.     2.2.3 Secondary Research
  20.     2.2.4 Primary Research
  21.       2.2.4.1 Primary Interviews and Information Gathering Process
  22.       2.2.4.2 Breakdown of Primary Respondents
  23.     2.2.5 Forecasting Model
  24.     2.2.6 Market Size Estimation
  25.       2.2.6.1 Bottom-Up Approach
  26.       2.2.6.2 Top-Down Approach
  27.     2.2.7 Data Triangulation
  28.     2.2.8 Validation
  29. 3 SECTION III: QUALITATIVE ANALYSIS
  30.   3.1 MARKET DYNAMICS
  31.     3.1.1 Overview
  32.     3.1.2 Drivers
  33.     3.1.3 Restraints
  34.     3.1.4 Opportunities
  35.   3.2 MARKET FACTOR ANALYSIS
  36.     3.2.1 Value chain Analysis
  37.     3.2.2 Porter's Five Forces Analysis
  38.       3.2.2.1 Bargaining Power of Suppliers
  39.       3.2.2.2 Bargaining Power of Buyers
  40.       3.2.2.3 Threat of New Entrants
  41.       3.2.2.4 Threat of Substitutes
  42.       3.2.2.5 Intensity of Rivalry
  43.     3.2.3 COVID-19 Impact Analysis
  44.       3.2.3.1 Market Impact Analysis
  45.       3.2.3.2 Regional Impact
  46.       3.2.3.3 Opportunity and Threat Analysis
  47. 4 SECTION IV: QUANTITATIVE ANALYSIS
  48.   4.1 Information and Communications Technology, BY Application (USD Billion)
  49.     4.1.1 Cybersecurity
  50.     4.1.2 Fraud Detection
  51.     4.1.3 Risk Management
  52.     4.1.4 Market Research Future
  53.     4.1.5 Competitive Intelligence
  54.   4.2 Information and Communications Technology, BY End Use (USD Billion)
  55.     4.2.1 Government
  56.     4.2.2 Financial Services
  57.     4.2.3 Healthcare
  58.     4.2.4 Retail
  59.     4.2.5 Telecommunications
  60.   4.3 Information and Communications Technology, BY Deployment Model (USD Billion)
  61.     4.3.1 Cloud-Based
  62.     4.3.2 On-Premises
  63.     4.3.3 Hybrid
  64.   4.4 Information and Communications Technology, BY Data Source (USD Billion)
  65.     4.4.1 Social Media
  66.     4.4.2 Public Records
  67.     4.4.3 News Articles
  68.     4.4.4 Websites
  69.     4.4.5 Forums
  70.   4.5 Information and Communications Technology, BY Technology (USD Billion)
  71.     4.5.1 Machine Learning
  72.     4.5.2 Natural Language Processing
  73.     4.5.3 Data Mining
  74.     4.5.4 Data Visualization
  75. 5 SECTION V: COMPETITIVE ANALYSIS
  76.   5.1 Competitive Landscape
  77.     5.1.1 Overview
  78.     5.1.2 Competitive Analysis
  79.     5.1.3 Market share Analysis
  80.     5.1.4 Major Growth Strategy in the Information and Communications Technology
  81.     5.1.5 Competitive Benchmarking
  82.     5.1.6 Leading Players in Terms of Number of Developments in the Information and Communications Technology
  83.     5.1.7 Key developments and growth strategies
  84.       5.1.7.1 New Product Launch/Service Deployment
  85.       5.1.7.2 Merger & Acquisitions
  86.       5.1.7.3 Joint Ventures
  87.     5.1.8 Major Players Financial Matrix
  88.       5.1.8.1 Sales and Operating Income
  89.       5.1.8.2 Major Players R&D Expenditure. 2023
  90.   5.2 Company Profiles
  91.     5.2.1 Palantir Technologies (US)
  92.       5.2.1.1 Financial Overview
  93.       5.2.1.2 Products Offered
  94.       5.2.1.3 Key Developments
  95.       5.2.1.4 SWOT Analysis
  96.       5.2.1.5 Key Strategies
  97.     5.2.2 Thales Group (FR)
  98.       5.2.2.1 Financial Overview
  99.       5.2.2.2 Products Offered
  100.       5.2.2.3 Key Developments
  101.       5.2.2.4 SWOT Analysis
  102.       5.2.2.5 Key Strategies
  103.     5.2.3 Bae Systems (GB)
  104.       5.2.3.1 Financial Overview
  105.       5.2.3.2 Products Offered
  106.       5.2.3.3 Key Developments
  107.       5.2.3.4 SWOT Analysis
  108.       5.2.3.5 Key Strategies
  109.     5.2.4 IBM (US)
  110.       5.2.4.1 Financial Overview
  111.       5.2.4.2 Products Offered
  112.       5.2.4.3 Key Developments
  113.       5.2.4.4 SWOT Analysis
  114.       5.2.4.5 Key Strategies
  115.     5.2.5 SAS Institute (US)
  116.       5.2.5.1 Financial Overview
  117.       5.2.5.2 Products Offered
  118.       5.2.5.3 Key Developments
  119.       5.2.5.4 SWOT Analysis
  120.       5.2.5.5 Key Strategies
  121.     5.2.6 Qlik (SE)
  122.       5.2.6.1 Financial Overview
  123.       5.2.6.2 Products Offered
  124.       5.2.6.3 Key Developments
  125.       5.2.6.4 SWOT Analysis
  126.       5.2.6.5 Key Strategies
  127.     5.2.7 Esri (US)
  128.       5.2.7.1 Financial Overview
  129.       5.2.7.2 Products Offered
  130.       5.2.7.3 Key Developments
  131.       5.2.7.4 SWOT Analysis
  132.       5.2.7.5 Key Strategies
  133.     5.2.8 Civica (GB)
  134.       5.2.8.1 Financial Overview
  135.       5.2.8.2 Products Offered
  136.       5.2.8.3 Key Developments
  137.       5.2.8.4 SWOT Analysis
  138.       5.2.8.5 Key Strategies
  139.   5.3 Appendix
  140.     5.3.1 References
  141.     5.3.2 Related Reports
  142. 6 LIST OF FIGURES
  143.   6.1 MARKET SYNOPSIS
  144.   6.2 EUROPE MARKET ANALYSIS BY APPLICATION
  145.   6.3 EUROPE MARKET ANALYSIS BY END USE
  146.   6.4 EUROPE MARKET ANALYSIS BY DEPLOYMENT MODEL
  147.   6.5 EUROPE MARKET ANALYSIS BY DATA SOURCE
  148.   6.6 EUROPE MARKET ANALYSIS BY TECHNOLOGY
  149.   6.7 KEY BUYING CRITERIA OF INFORMATION AND COMMUNICATIONS TECHNOLOGY
  150.   6.8 RESEARCH PROCESS OF MRFR
  151.   6.9 DRO ANALYSIS OF INFORMATION AND COMMUNICATIONS TECHNOLOGY
  152.   6.10 DRIVERS IMPACT ANALYSIS: INFORMATION AND COMMUNICATIONS TECHNOLOGY
  153.   6.11 RESTRAINTS IMPACT ANALYSIS: INFORMATION AND COMMUNICATIONS TECHNOLOGY
  154.   6.12 SUPPLY / VALUE CHAIN: INFORMATION AND COMMUNICATIONS TECHNOLOGY
  155.   6.13 INFORMATION AND COMMUNICATIONS TECHNOLOGY, BY APPLICATION, 2024 (% SHARE)
  156.   6.14 INFORMATION AND COMMUNICATIONS TECHNOLOGY, BY APPLICATION, 2024 TO 2035 (USD Billion)
  157.   6.15 INFORMATION AND COMMUNICATIONS TECHNOLOGY, BY END USE, 2024 (% SHARE)
  158.   6.16 INFORMATION AND COMMUNICATIONS TECHNOLOGY, BY END USE, 2024 TO 2035 (USD Billion)
  159.   6.17 INFORMATION AND COMMUNICATIONS TECHNOLOGY, BY DEPLOYMENT MODEL, 2024 (% SHARE)
  160.   6.18 INFORMATION AND COMMUNICATIONS TECHNOLOGY, BY DEPLOYMENT MODEL, 2024 TO 2035 (USD Billion)
  161.   6.19 INFORMATION AND COMMUNICATIONS TECHNOLOGY, BY DATA SOURCE, 2024 (% SHARE)
  162.   6.20 INFORMATION AND COMMUNICATIONS TECHNOLOGY, BY DATA SOURCE, 2024 TO 2035 (USD Billion)
  163.   6.21 INFORMATION AND COMMUNICATIONS TECHNOLOGY, BY TECHNOLOGY, 2024 (% SHARE)
  164.   6.22 INFORMATION AND COMMUNICATIONS TECHNOLOGY, BY TECHNOLOGY, 2024 TO 2035 (USD Billion)
  165.   6.23 BENCHMARKING OF MAJOR COMPETITORS
  166. 7 LIST OF TABLES
  167.   7.1 LIST OF ASSUMPTIONS
  168.     7.1.1
  169.   7.2 Europe MARKET SIZE ESTIMATES; FORECAST
  170.     7.2.1 BY APPLICATION, 2026-2035 (USD Billion)
  171.     7.2.2 BY END USE, 2026-2035 (USD Billion)
  172.     7.2.3 BY DEPLOYMENT MODEL, 2026-2035 (USD Billion)
  173.     7.2.4 BY DATA SOURCE, 2026-2035 (USD Billion)
  174.     7.2.5 BY TECHNOLOGY, 2026-2035 (USD Billion)
  175.   7.3 PRODUCT LAUNCH/PRODUCT DEVELOPMENT/APPROVAL
  176.     7.3.1
  177.   7.4 ACQUISITION/PARTNERSHIP
  178.     7.4.1

Europe Information and Communications Technology Market Segmentation

Information and Communications Technology By Application (USD Billion, 2022-2035)

  • Cybersecurity
  • Fraud Detection
  • Risk Management
  • Market Research Future
  • Competitive Intelligence

Information and Communications Technology By End Use (USD Billion, 2022-2035)

  • Government
  • Financial Services
  • Healthcare
  • Retail
  • Telecommunications

Information and Communications Technology By Deployment Model (USD Billion, 2022-2035)

  • Cloud-Based
  • On-Premises
  • Hybrid

Information and Communications Technology By Data Source (USD Billion, 2022-2035)

  • Social Media
  • Public Records
  • News Articles
  • Websites
  • Forums

Information and Communications Technology By Technology (USD Billion, 2022-2035)

  • Machine Learning
  • Natural Language Processing
  • Data Mining
  • Data Visualization

Compare Licence

×
Features License Type
Single User Multiuser License Enterprise User
Price $4,950 $5,950 $7,250
Maximum User Access Limit 1 User Upto 10 Users Unrestricted Access Throughout the Organization
Free Customization
Direct Access to Analyst
Deliverable Format
Platform Access
Discount on Next Purchase 10% 15% 15%
Printable Versions