Request Free Sample ×

Kindly complete the form below to receive a free sample of this Report

* Please use a valid business email

Leading companies partner with us for data-driven Insights

clients tt-cursor
Hero Background

Europe Lead Acid Battery Market

ID: MRFR/EnP/53600-HCR
200 Pages
Chitranshi Jaiswal
Last Updated: February 06, 2026

Europe Lead Acid Battery Market Research Report By Application (Automotive, Industrial, Telecommunications, Renewable Energy, Uninterruptible Power Supply), By Type (Flooded Lead Acid Batteries, Sealed Lead Acid Batteries, Absorbent Glass Mat Batteries, Vent Valve Regulated Batteries), By End Use (Transportation, Backup Power, Energy Storage, Electric Vehicles), By Maintenance Type (Maintenance-Free, Regular Maintenance) and By Regional (Germany, UK, France, Russia, Italy, Spain, Rest of Europe)- Forecast to 2035

Share:
Download PDF ×

We do not share your information with anyone. However, we may send you emails based on your report interest from time to time. You may contact us at any time to opt-out.

Europe Lead Acid Battery Market Infographic
Purchase Options
  1. 1 SECTION I: EXECUTIVE SUMMARY AND KEY HIGHLIGHTS
  2.   1.1 EXECUTIVE SUMMARY
  3.     1.1.1 Market Overview
  4.     1.1.2 Key Findings
  5.     1.1.3 Market Segmentation
  6.     1.1.4 Competitive Landscape
  7.     1.1.5 Challenges and Opportunities
  8.     1.1.6 Future Outlook
  9. 2 SECTION II: SCOPING, METHODOLOGY AND MARKET STRUCTURE
  10.   2.1 MARKET INTRODUCTION
  11.     2.1.1 Definition
  12.     2.1.2 Scope of the study
  13.       2.1.2.1 Research Objective
  14.       2.1.2.2 Assumption
  15.       2.1.2.3 Limitations
  16.   2.2 RESEARCH METHODOLOGY
  17.     2.2.1 Overview
  18.     2.2.2 Data Mining
  19.     2.2.3 Secondary Research
  20.     2.2.4 Primary Research
  21.       2.2.4.1 Primary Interviews and Information Gathering Process
  22.       2.2.4.2 Breakdown of Primary Respondents
  23.     2.2.5 Forecasting Model
  24.     2.2.6 Market Size Estimation
  25.       2.2.6.1 Bottom-Up Approach
  26.       2.2.6.2 Top-Down Approach
  27.     2.2.7 Data Triangulation
  28.     2.2.8 Validation
  29. 3 SECTION III: QUALITATIVE ANALYSIS
  30.   3.1 MARKET DYNAMICS
  31.     3.1.1 Overview
  32.     3.1.2 Drivers
  33.     3.1.3 Restraints
  34.     3.1.4 Opportunities
  35.   3.2 MARKET FACTOR ANALYSIS
  36.     3.2.1 Value chain Analysis
  37.     3.2.2 Porter's Five Forces Analysis
  38.       3.2.2.1 Bargaining Power of Suppliers
  39.       3.2.2.2 Bargaining Power of Buyers
  40.       3.2.2.3 Threat of New Entrants
  41.       3.2.2.4 Threat of Substitutes
  42.       3.2.2.5 Intensity of Rivalry
  43.     3.2.3 COVID-19 Impact Analysis
  44.       3.2.3.1 Market Impact Analysis
  45.       3.2.3.2 Regional Impact
  46.       3.2.3.3 Opportunity and Threat Analysis
  47. 4 SECTION IV: QUANTITATIVE ANALYSIS
  48.   4.1 Energy & Power, BY Application (USD Billion)
  49.     4.1.1 Automotive
  50.     4.1.2 Industrial
  51.     4.1.3 Telecom
  52.     4.1.4 Renewable Energy
  53.     4.1.5 Uninterruptible Power Supply
  54.   4.2 Energy & Power, BY End Use (USD Billion)
  55.     4.2.1 Passenger Vehicles
  56.     4.2.2 Commercial Vehicles
  57.     4.2.3 Forklifts
  58.     4.2.4 Telecommunication Equipment
  59.     4.2.5 Energy Storage Systems
  60.   4.3 Energy & Power, BY Technology (USD Billion)
  61.     4.3.1 Flooded Lead Acid Battery
  62.     4.3.2 Absorbent Glass Mat
  63.     4.3.3 Gel Lead Acid Battery
  64.     4.3.4 Sealed Lead Acid Battery
  65.     4.3.5 Enhanced Flooded Battery
  66.   4.4 Energy & Power, BY Sales Channel (USD Billion)
  67.     4.4.1 Direct Sales
  68.     4.4.2 Distributors
  69.     4.4.3 Online Sales
  70.     4.4.4 Retail Sales
  71.     4.4.5 OEM
  72.   4.5 Energy & Power, BY Battery Type (USD Billion)
  73.     4.5.1 Starting Lighting Ignition
  74.     4.5.2 Deep Cycle
  75.     4.5.3 SLA
  76.     4.5.4 AGM
  77.     4.5.5 Gel
  78. 5 SECTION V: COMPETITIVE ANALYSIS
  79.   5.1 Competitive Landscape
  80.     5.1.1 Overview
  81.     5.1.2 Competitive Analysis
  82.     5.1.3 Market share Analysis
  83.     5.1.4 Major Growth Strategy in the Energy & Power
  84.     5.1.5 Competitive Benchmarking
  85.     5.1.6 Leading Players in Terms of Number of Developments in the Energy & Power
  86.     5.1.7 Key developments and growth strategies
  87.       5.1.7.1 New Product Launch/Service Deployment
  88.       5.1.7.2 Merger & Acquisitions
  89.       5.1.7.3 Joint Ventures
  90.     5.1.8 Major Players Financial Matrix
  91.       5.1.8.1 Sales and Operating Income
  92.       5.1.8.2 Major Players R&D Expenditure. 2023
  93.   5.2 Company Profiles
  94.     5.2.1 Exide Technologies (US)
  95.       5.2.1.1 Financial Overview
  96.       5.2.1.2 Products Offered
  97.       5.2.1.3 Key Developments
  98.       5.2.1.4 SWOT Analysis
  99.       5.2.1.5 Key Strategies
  100.     5.2.2 Johnson Controls (IE)
  101.       5.2.2.1 Financial Overview
  102.       5.2.2.2 Products Offered
  103.       5.2.2.3 Key Developments
  104.       5.2.2.4 SWOT Analysis
  105.       5.2.2.5 Key Strategies
  106.     5.2.3 Yuasa Battery (JP)
  107.       5.2.3.1 Financial Overview
  108.       5.2.3.2 Products Offered
  109.       5.2.3.3 Key Developments
  110.       5.2.3.4 SWOT Analysis
  111.       5.2.3.5 Key Strategies
  112.     5.2.4 East Penn Manufacturing (US)
  113.       5.2.4.1 Financial Overview
  114.       5.2.4.2 Products Offered
  115.       5.2.4.3 Key Developments
  116.       5.2.4.4 SWOT Analysis
  117.       5.2.4.5 Key Strategies
  118.     5.2.5 C&D Technologies (US)
  119.       5.2.5.1 Financial Overview
  120.       5.2.5.2 Products Offered
  121.       5.2.5.3 Key Developments
  122.       5.2.5.4 SWOT Analysis
  123.       5.2.5.5 Key Strategies
  124.     5.2.6 Sonnenschein (DE)
  125.       5.2.6.1 Financial Overview
  126.       5.2.6.2 Products Offered
  127.       5.2.6.3 Key Developments
  128.       5.2.6.4 SWOT Analysis
  129.       5.2.6.5 Key Strategies
  130.     5.2.7 Banner Batteries (AT)
  131.       5.2.7.1 Financial Overview
  132.       5.2.7.2 Products Offered
  133.       5.2.7.3 Key Developments
  134.       5.2.7.4 SWOT Analysis
  135.       5.2.7.5 Key Strategies
  136.     5.2.8 VARTA (DE)
  137.       5.2.8.1 Financial Overview
  138.       5.2.8.2 Products Offered
  139.       5.2.8.3 Key Developments
  140.       5.2.8.4 SWOT Analysis
  141.       5.2.8.5 Key Strategies
  142.     5.2.9 Fiamm (IT)
  143.       5.2.9.1 Financial Overview
  144.       5.2.9.2 Products Offered
  145.       5.2.9.3 Key Developments
  146.       5.2.9.4 SWOT Analysis
  147.       5.2.9.5 Key Strategies
  148.   5.3 Appendix
  149.     5.3.1 References
  150.     5.3.2 Related Reports
  151. 6 LIST OF FIGURES
  152.   6.1 MARKET SYNOPSIS
  153.   6.2 EUROPE MARKET ANALYSIS BY APPLICATION
  154.   6.3 EUROPE MARKET ANALYSIS BY END USE
  155.   6.4 EUROPE MARKET ANALYSIS BY TECHNOLOGY
  156.   6.5 EUROPE MARKET ANALYSIS BY SALES CHANNEL
  157.   6.6 EUROPE MARKET ANALYSIS BY BATTERY TYPE
  158.   6.7 KEY BUYING CRITERIA OF ENERGY & POWER
  159.   6.8 RESEARCH PROCESS OF MRFR
  160.   6.9 DRO ANALYSIS OF ENERGY & POWER
  161.   6.10 DRIVERS IMPACT ANALYSIS: ENERGY & POWER
  162.   6.11 RESTRAINTS IMPACT ANALYSIS: ENERGY & POWER
  163.   6.12 SUPPLY / VALUE CHAIN: ENERGY & POWER
  164.   6.13 ENERGY & POWER, BY APPLICATION, 2024 (% SHARE)
  165.   6.14 ENERGY & POWER, BY APPLICATION, 2024 TO 2035 (USD Billion)
  166.   6.15 ENERGY & POWER, BY END USE, 2024 (% SHARE)
  167.   6.16 ENERGY & POWER, BY END USE, 2024 TO 2035 (USD Billion)
  168.   6.17 ENERGY & POWER, BY TECHNOLOGY, 2024 (% SHARE)
  169.   6.18 ENERGY & POWER, BY TECHNOLOGY, 2024 TO 2035 (USD Billion)
  170.   6.19 ENERGY & POWER, BY SALES CHANNEL, 2024 (% SHARE)
  171.   6.20 ENERGY & POWER, BY SALES CHANNEL, 2024 TO 2035 (USD Billion)
  172.   6.21 ENERGY & POWER, BY BATTERY TYPE, 2024 (% SHARE)
  173.   6.22 ENERGY & POWER, BY BATTERY TYPE, 2024 TO 2035 (USD Billion)
  174.   6.23 BENCHMARKING OF MAJOR COMPETITORS
  175. 7 LIST OF TABLES
  176.   7.1 LIST OF ASSUMPTIONS
  177.     7.1.1
  178.   7.2 Europe MARKET SIZE ESTIMATES; FORECAST
  179.     7.2.1 BY APPLICATION, 2026-2035 (USD Billion)
  180.     7.2.2 BY END USE, 2026-2035 (USD Billion)
  181.     7.2.3 BY TECHNOLOGY, 2026-2035 (USD Billion)
  182.     7.2.4 BY SALES CHANNEL, 2026-2035 (USD Billion)
  183.     7.2.5 BY BATTERY TYPE, 2026-2035 (USD Billion)
  184.   7.3 PRODUCT LAUNCH/PRODUCT DEVELOPMENT/APPROVAL
  185.     7.3.1
  186.   7.4 ACQUISITION/PARTNERSHIP
  187.     7.4.1

Europe Energy & Power Market Segmentation

Energy & Power By Application (USD Billion, 2022-2035)
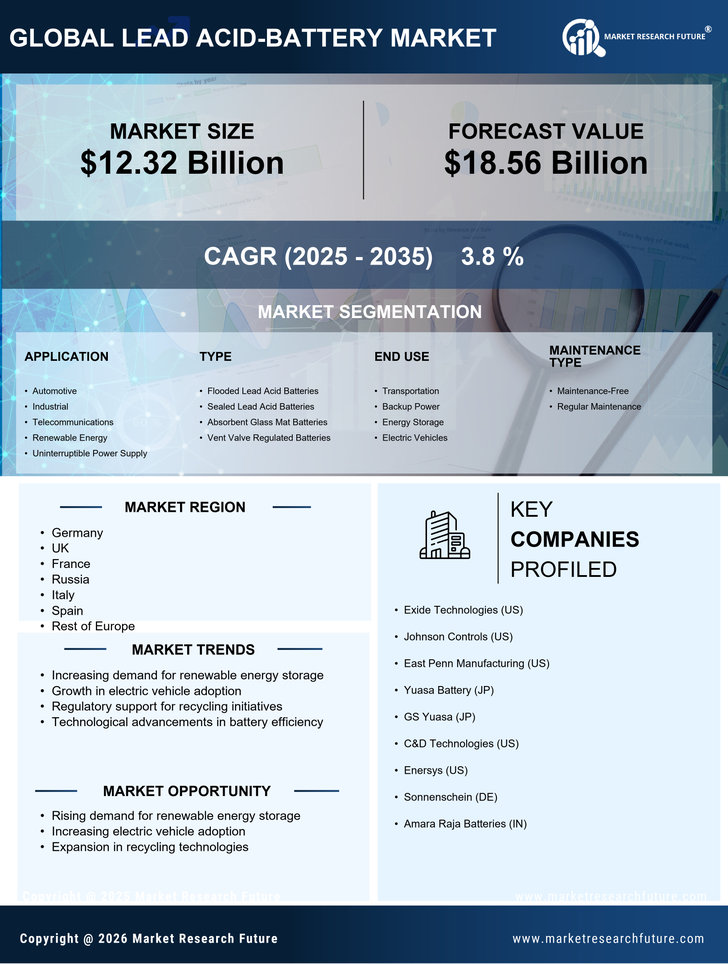
  • Automotive
  • Industrial
  • Telecom
  • Renewable Energy
  • Uninterruptible Power Supply

Energy & Power By End Use (USD Billion, 2022-2035)

  • Passenger Vehicles
  • Commercial Vehicles
  • Forklifts
  • Telecommunication Equipment
  • Energy Storage Systems

Energy & Power By Technology (USD Billion, 2022-2035)

  • Flooded Lead Acid Battery
  • Absorbent Glass Mat
  • Gel Lead Acid Battery
  • Sealed Lead Acid Battery
  • Enhanced Flooded Battery

Energy & Power By Sales Channel (USD Billion, 2022-2035)

  • Direct Sales
  • Distributors
  • Online Sales
  • Retail Sales
  • OEM

Energy & Power By Battery Type (USD Billion, 2022-2035)

  • Starting Lighting Ignition
  • Deep Cycle
  • SLA
  • AGM
  • Gel

Compare Licence

×
Features License Type
Single User Multiuser License Enterprise User
Price $4,950 $5,950 $7,250
Maximum User Access Limit 1 User Upto 10 Users Unrestricted Access Throughout the Organization
Free Customization
Direct Access to Analyst
Deliverable Format
Platform Access
Discount on Next Purchase 10% 15% 15%
Printable Versions