Europe In Memory Computing Market

ID: MRFR/ICT/63418-HCR
200 Pages
Aarti Dhapte
Last Updated: May 02, 2026
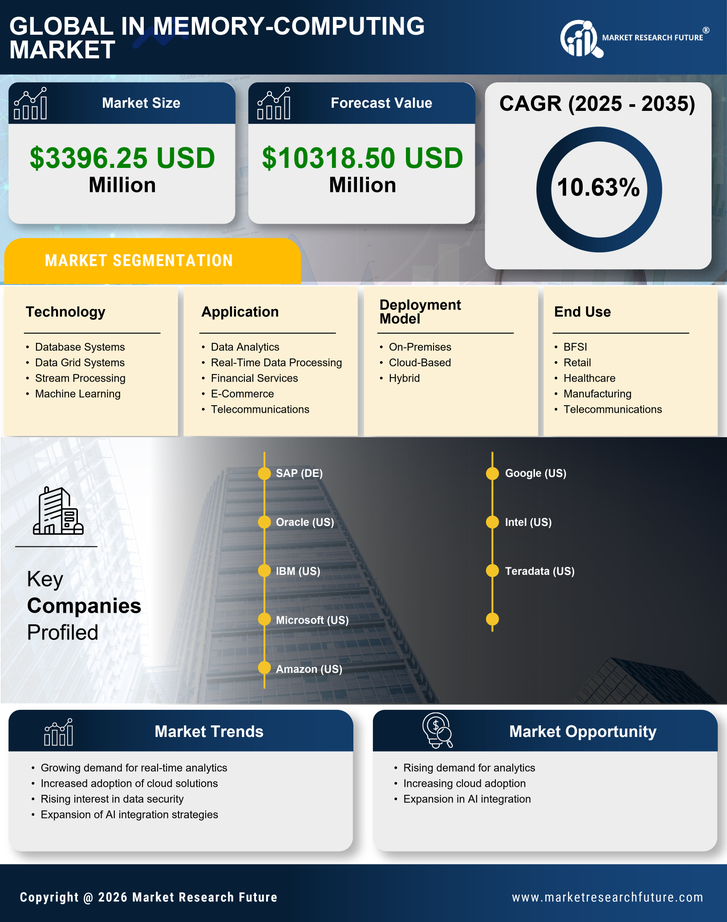
Europe In-Memory Computing Market Size, Share and Research Report: By Application (Data Analytics, Real-Time Data Processing, Financial Services, E-Commerce, Telecommunications), By Deployment Model (On-Premises, Cloud-Based, Hybrid), By Technology (Database Systems, Data Grid Systems, Stream Processing, Machine Learning), By End Use (BFSI, Retail, Healthcare, Manufacturing, Telecommunications) and By Regional (Germany, UK, France, Russia, Italy, Spain, Rest of Europe)- Industry Forecast to 2035
Download PDF ×

We do not share your information with anyone. However, we may send you emails based on your report interest from time to time. You may contact us at any time to opt-out.

  1. SECTION I: EXECUTIVE SUMMARY AND KEY HIGHLIGHTS |
    1. 1.1 EXECUTIVE SUMMARY | |
      1. 1.1.1 Market Overview | |
      2. 1.1.2 Key Findings | |
      3. 1.1.3 Market Segmentation | |
      4. 1.1.4 Competitive Landscape | |
      5. 1.1.5 Challenges and Opportunities | |
      6. 1.1.6 Future Outlook 2
  2. SECTION II: SCOPING, METHODOLOGY AND MARKET STRUCTURE |
    1. 2.1 MARKET INTRODUCTION | |
      1. 2.1.1 Definition | |
      2. 2.1.2 Scope of the study | | |
        1. 2.1.2.1 Research Objective | | |
        2. 2.1.2.2 Assumption | | |
        3. 2.1.2.3 Limitations |
    2. 2.2 RESEARCH METHODOLOGY | |
      1. 2.2.1 Overview | |
      2. 2.2.2 Data Mining | |
      3. 2.2.3 Secondary Research | |
      4. 2.2.4 Primary Research | | |
        1. 2.2.4.1 Primary Interviews and Information Gathering Process | | |
        2. 2.2.4.2 Breakdown of Primary Respondents | |
      5. 2.2.5 Forecasting Model | |
      6. 2.2.6 Market Size Estimation | | |
        1. 2.2.6.1 Bottom-Up Approach | | |
        2. 2.2.6.2 Top-Down Approach | |
      7. 2.2.7 Data Triangulation | |
      8. 2.2.8 Validation 3
  3. SECTION III: QUALITATIVE ANALYSIS |
    1. 3.1 MARKET DYNAMICS | |
      1. 3.1.1 Overview | |
      2. 3.1.2 Drivers | |
      3. 3.1.3 Restraints | |
      4. 3.1.4 Opportunities |
    2. 3.2 MARKET FACTOR ANALYSIS | |
      1. 3.2.1 Value chain Analysis | |
      2. 3.2.2 Porter's Five Forces Analysis | | |
        1. 3.2.2.1 Bargaining Power of Suppliers | | |
        2. 3.2.2.2 Bargaining Power of Buyers | | |
        3. 3.2.2.3 Threat of New Entrants | | |
        4. 3.2.2.4 Threat of Substitutes | | |
        5. 3.2.2.5 Intensity of Rivalry | |
      3. 3.2.3 COVID-19 Impact Analysis | | |
        1. 3.2.3.1 Market Impact Analysis | | |
        2. 3.2.3.2 Regional Impact | | |
        3. 3.2.3.3 Opportunity and Threat Analysis 4
  4. SECTION IV: QUANTITATIVE ANALYSIS |
    1. 4.1 Information and Communications Technology, BY Application (USD Billion) | |
      1. 4.1.1 Data Analytics | |
      2. 4.1.2 Artificial Intelligence | |
      3. 4.1.3 Machine Learning | |
      4. 4.1.4 Real-Time Processing | |
      5. 4.1.5 Edge Computing |
    2. 4.2 Information and Communications Technology, BY End Use (USD Billion) | |
      1. 4.2.1 Telecommunications | |
      2. 4.2.2 Healthcare | |
      3. 4.2.3 Automotive | |
      4. 4.2.4 Financial Services | |
      5. 4.2.5 Retail |
    3. 4.3 Information and Communications Technology, BY Technology (USD Billion) | |
      1. 4.3.1 Non-Volatile Memory | |
      2. 4.3.2 Dynamic Random Access Memory | |
      3. 4.3.3 Flash Memory | |
      4. 4.3.4 Storage Class Memory | |
      5. 4.3.5 3D XPoint |
    4. 4.4 Information and Communications Technology, BY Deployment Model (USD Billion) | |
      1. 4.4.1 On-Premises | |
      2. 4.4.2 Cloud-Based | |
      3. 4.4.3 Hybrid |
    5. 4.5 Information and Communications Technology, BY Organization Size (USD Billion) | |
      1. 4.5.1 Small Enterprises | |
      2. 4.5.2 Medium Enterprises | |
      3. 4.5.3 Large Enterprises 5
  5. SECTION V: COMPETITIVE ANALYSIS |
    1. 5.1 Competitive Landscape | |
      1. 5.1.1 Overview | |
      2. 5.1.2 Competitive Analysis | |
      3. 5.1.3 Market share Analysis | |
      4. 5.1.4 Major Growth Strategy in the Information and Communications Technology | |
      5. 5.1.5 Competitive Benchmarking | |
      6. 5.1.6 Leading Players in Terms of Number of Developments in the Information and Communications Technology | |
      7. 5.1.7 Key developments and growth strategies | | |
        1. 5.1.7.1 New Product Launch/Service Deployment | | |
        2. 5.1.7.2 Merger & Acquisitions | | |
        3. 5.1.7.3 Joint Ventures | |
      8. 5.1.8 Major Players Financial Matrix | | |
        1. 5.1.8.1 Sales and Operating Income | | |
        2. 5.1.8.2 Major Players R&D Expenditure. 2023 |
    2. 5.2 Company Profiles | |
      1. 5.2.1 SAP (DE) | | |
        1. 5.2.1.1 Financial Overview | | |
        2. 5.2.1.2 Products Offered | | |
        3. 5.2.1.3 Key Developments | | |
        4. 5.2.1.4 SWOT Analysis | | |
        5. 5.2.1.5 Key Strategies | |
      2. 5.2.2 IBM (US) | | |
        1. 5.2.2.1 Financial Overview | | |
        2. 5.2.2.2 Products Offered | | |
        3. 5.2.2.3 Key Developments | | |
        4. 5.2.2.4 SWOT Analysis | | |
        5. 5.2.2.5 Key Strategies | |
      3. 5.2.3 Microsoft (GB) | | |
        1. 5.2.3.1 Financial Overview | | |
        2. 5.2.3.2 Products Offered | | |
        3. 5.2.3.3 Key Developments | | |
        4. 5.2.3.4 SWOT Analysis | | |
        5. 5.2.3.5 Key Strategies | |
      4. 5.2.4 Oracle (US) | | |
        1. 5.2.4.1 Financial Overview | | |
        2. 5.2.4.2 Products Offered | | |
        3. 5.2.4.3 Key Developments | | |
        4. 5.2.4.4 SWOT Analysis | | |
        5. 5.2.4.5 Key Strategies | |
      5. 5.2.5 Intel (US) | | |
        1. 5.2.5.1 Financial Overview | | |
        2. 5.2.5.2 Products Offered | | |
        3. 5.2.5.3 Key Developments | | |
        4. 5.2.5.4 SWOT Analysis | | |
        5. 5.2.5.5 Key Strategies | |
      6. 5.2.6 Hewlett Packard Enterprise (US) | | |
        1. 5.2.6.1 Financial Overview | | |
        2. 5.2.6.2 Products Offered | | |
        3. 5.2.6.3 Key Developments | | |
        4. 5.2.6.4 SWOT Analysis | | |
        5. 5.2.6.5 Key Strategies | |
      7. 5.2.7 Dell Technologies (US) | | |
        1. 5.2.7.1 Financial Overview | | |
        2. 5.2.7.2 Products Offered | | |
        3. 5.2.7.3 Key Developments | | |
        4. 5.2.7.4 SWOT Analysis | | |
        5. 5.2.7.5 Key Strategies | |
      8. 5.2.8 Atos (FR) | | |
        1. 5.2.8.1 Financial Overview | | |
        2. 5.2.8.2 Products Offered | | |
        3. 5.2.8.3 Key Developments | | |
        4. 5.2.8.4 SWOT Analysis | | |
        5. 5.2.8.5 Key Strategies | |
      9. 5.2.9 Fujitsu (JP) | | |
        1. 5.2.9.1 Financial Overview | | |
        2. 5.2.9.2 Products Offered | | |
        3. 5.2.9.3 Key Developments | | |
        4. 5.2.9.4 SWOT Analysis | | |
        5. 5.2.9.5 Key Strategies |
    3. 5.3 Appendix | |
      1. 5.3.1 References | |
      2. 5.3.2 Related Reports 6 LIST OF FIGURES |
    4. 6.1 MARKET SYNOPSIS |
    5. 6.2 EUROPE MARKET ANALYSIS BY APPLICATION |
    6. 6.3 EUROPE MARKET ANALYSIS BY END USE |
    7. 6.4 EUROPE MARKET ANALYSIS BY TECHNOLOGY |
    8. 6.5 EUROPE MARKET ANALYSIS BY DEPLOYMENT MODEL |
    9. 6.6 EUROPE MARKET ANALYSIS BY ORGANIZATION SIZE |
    10. 6.7 KEY BUYING CRITERIA OF INFORMATION AND COMMUNICATIONS TECHNOLOGY |
    11. 6.8 RESEARCH PROCESS OF MRFR |
    12. 6.9 DRO ANALYSIS OF INFORMATION AND COMMUNICATIONS TECHNOLOGY |
    13. 6.10 DRIVERS IMPACT ANALYSIS: INFORMATION AND COMMUNICATIONS TECHNOLOGY |
    14. 6.11 RESTRAINTS IMPACT ANALYSIS: INFORMATION AND COMMUNICATIONS TECHNOLOGY |
    15. 6.12 SUPPLY / VALUE CHAIN: INFORMATION AND COMMUNICATIONS TECHNOLOGY |
    16. 6.13 INFORMATION AND COMMUNICATIONS TECHNOLOGY, BY APPLICATION, 2024 (% SHARE) |
    17. 6.14 INFORMATION AND COMMUNICATIONS TECHNOLOGY, BY APPLICATION, 2024 TO 2035 (USD Billion) |
    18. 6.15 INFORMATION AND COMMUNICATIONS TECHNOLOGY, BY END USE, 2024 (% SHARE) |
    19. 6.16 INFORMATION AND COMMUNICATIONS TECHNOLOGY, BY END USE, 2024 TO 2035 (USD Billion) |
    20. 6.17 INFORMATION AND COMMUNICATIONS TECHNOLOGY, BY TECHNOLOGY, 2024 (% SHARE) |
    21. 6.18 INFORMATION AND COMMUNICATIONS TECHNOLOGY, BY TECHNOLOGY, 2024 TO 2035 (USD Billion) |
    22. 6.19 INFORMATION AND COMMUNICATIONS TECHNOLOGY, BY DEPLOYMENT MODEL, 2024 (% SHARE) |
    23. 6.20 INFORMATION AND COMMUNICATIONS TECHNOLOGY, BY DEPLOYMENT MODEL, 2024 TO 2035 (USD Billion) |
    24. 6.21 INFORMATION AND COMMUNICATIONS TECHNOLOGY, BY ORGANIZATION SIZE, 2024 (% SHARE) |
    25. 6.22 INFORMATION AND COMMUNICATIONS TECHNOLOGY, BY ORGANIZATION SIZE, 2024 TO 2035 (USD Billion) |
    26. 6.23 BENCHMARKING OF MAJOR COMPETITORS 7 LIST OF TABLES |
    27. 7.1 LIST OF ASSUMPTIONS | |
      1. 7.1.1 |
    28. 7.2 Europe MARKET SIZE ESTIMATES; FORECAST | |
      1. 7.2.1 BY APPLICATION, 2026-2035 (USD Billion) | |
      2. 7.2.2 BY END USE, 2026-2035 (USD Billion) | |
      3. 7.2.3 BY TECHNOLOGY, 2026-2035 (USD Billion) | |
      4. 7.2.4 BY DEPLOYMENT MODEL, 2026-2035 (USD Billion) | |
      5. 7.2.5 BY ORGANIZATION SIZE, 2026-2035 (USD Billion) |
    29. 7.3 PRODUCT LAUNCH/PRODUCT DEVELOPMENT/APPROVAL | |
      1. 7.3.1 |
    30. 7.4 ACQUISITION/PARTNERSHIP | |

Europe Information and Communications Technology Market Segmentation

Information and Communications Technology By Application (USD Billion, 2022-2035)

  • Data Analytics
  • Artificial Intelligence
  • Machine Learning
  • Real-Time Processing
  • Edge Computing

Information and Communications Technology By End Use (USD Billion, 2022-2035)

  • Telecommunications
  • Healthcare
  • Automotive
  • Financial Services
  • Retail

Information and Communications Technology By Technology (USD Billion, 2022-2035)

  • Non-Volatile Memory
  • Dynamic Random Access Memory
  • Flash Memory
  • Storage Class Memory
  • 3D XPoint

Information and Communications Technology By Deployment Model (USD Billion, 2022-2035)

  • On-Premises
  • Cloud-Based
  • Hybrid

Information and Communications Technology By Organization Size (USD Billion, 2022-2035)

  • Small Enterprises
  • Medium Enterprises
  • Large Enterprises