Europe Europe Digital Asset Management Software Market Segmentation
Europe Digital Asset Management Software Market By Application (USD Billion, 2022-2035)
- Brand Management
- Content Management
- Digital Marketing
- Media Management
- Product Management
Europe Digital Asset Management Software Market By End Use (USD Billion, 2022-2035)
- Advertising Agencies
- Media and Entertainment
- Retail
- Education
- Healthcare
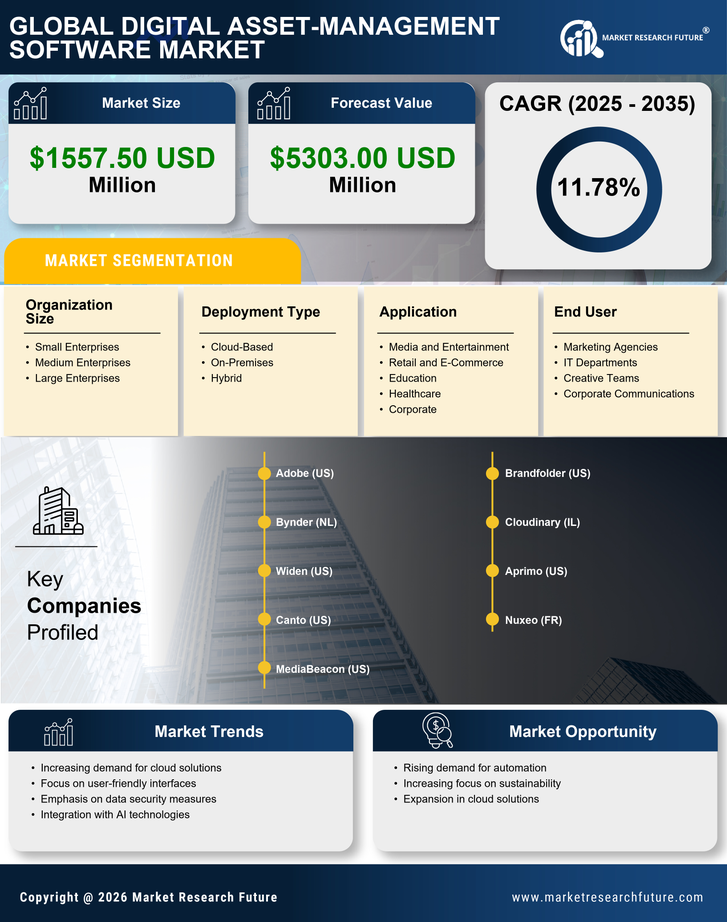
Europe Digital Asset Management Software Market By Deployment Type (USD Billion, 2022-2035)
- Cloud-Based
- On-Premises
- Hybrid
Europe Digital Asset Management Software Market By Organization Size (USD Billion, 2022-2035)
- Small Enterprises
- Medium Enterprises
- Large Enterprises
Europe Digital Asset Management Software Market By Industry Vertical (USD Billion, 2022-2035)
- Retail
- Healthcare
- Education
- Media and Entertainment
- Manufacturing