Europe Aquarium Market

ID: MRFR/CG/44968-HCR
128 Pages
Snehal Singh
Last Updated: April 06, 2026
Europe Aquarium Market Size, Share, Industry Trend & Analysis Research Report By Application (Recreational, Educational, Research), By Product Type (Freshwater Aquariums, Saltwater Aquariums, Brackish Aquariums), By Component (Tank, Filtration System, Substrate, Heater, Others) and By Distribution Channel (Online, Offline) - Forecast to 2035
Download PDF ×

We do not share your information with anyone. However, we may send you emails based on your report interest from time to time. You may contact us at any time to opt-out.

Europe Aquarium Market

Market Size

Forecast Period2025 - 2035
CAGR (2025 - 2035)7.57%
2024 Market Size$ 2,223.34 Million
2025 Market Size$ 2,391.64 Million
2035 Market Size$ 4,962.42 Million

Key Players

Spectrum Brands
Tetra
Aquatic Eco-Systems
Hagen
Eheim
Fluval
Opportunities
  • Increased Urbanization
  • Rising Disposable Income
  • Influence of Social Media
  1. 1 SECTION I: EXECUTIVE SUMMARY AND KEY HIGHLIGHTS
    1. 1.1 EXECUTIVE SUMMARY
      1. 1.1.1 Market Overview
      2. 1.1.2 Key Findings
      3. 1.1.3 Market Segmentation
      4. 1.1.4 Competitive Landscape
      5. 1.1.5 Challenges and Opportunities
      6. 1.1.6 Future Outlook
  2. 2 SECTION II: SCOPING, METHODOLOGY AND MARKET STRUCTURE
    1. 2.1 MARKET INTRODUCTION
      1. 2.1.1 Definition
      2. 2.1.2 Scope of the study
        1. 2.1.2.1 Research Objective
        2. 2.1.2.2 Assumption
        3. 2.1.2.3 Limitations
    2. 2.2 RESEARCH METHODOLOGY
      1. 2.2.1 Overview
      2. 2.2.2 Data Mining
      3. 2.2.3 Secondary Research
      4. 2.2.4 Primary Research
        1. 2.2.4.1 Primary Interviews and Information Gathering Process
        2. 2.2.4.2 Breakdown of Primary Respondents
      5. 2.2.5 Forecasting Model
      6. 2.2.6 Market Size Estimation
        1. 2.2.6.1 Bottom-Up Approach
        2. 2.2.6.2 Top-Down Approach
      7. 2.2.7 Data Triangulation
      8. 2.2.8 Validation
  3. 3 SECTION III: QUALITATIVE ANALYSIS
    1. 3.1 MARKET DYNAMICS
      1. 3.1.1 Overview
      2. 3.1.2 Drivers
      3. 3.1.3 Restraints
      4. 3.1.4 Opportunities
    2. 3.2 MARKET FACTOR ANALYSIS
      1. 3.2.1 Value chain Analysis
      2. 3.2.2 Porter's Five Forces Analysis
        1. 3.2.2.1 Bargaining Power of Suppliers
        2. 3.2.2.2 Bargaining Power of Buyers
        3. 3.2.2.3 Threat of New Entrants
        4. 3.2.2.4 Threat of Substitutes
        5. 3.2.2.5 Intensity of Rivalry
      3. 3.2.3 COVID-19 Impact Analysis
        1. 3.2.3.1 Market Impact Analysis
        2. 3.2.3.2 Regional Impact
        3. 3.2.3.3 Opportunity and Threat Analysis
  4. 4 SECTION IV: QUANTITATIVE ANALYSIS
    1. 4.1 Construction, BY Application (USD Million)
      1. 4.1.1 Recreational
      2. 4.1.2 Educational
      3. 4.1.3 Research
    2. 4.2 Construction, BY Product Type (USD Million)
      1. 4.2.1 Freshwater Aquariums
      2. 4.2.2 Saltwater Aquariums
      3. 4.2.3 Brackish Aquariums
    3. 4.3 Construction, BY Component (USD Million)
      1. 4.3.1 Tank
      2. 4.3.2 Filtration System
      3. 4.3.3 Substrate
      4. 4.3.4 Heater
      5. 4.3.5 Others
    4. 4.4 Construction, BY Distribution Channel (USD Million)
      1. 4.4.1 Online
      2. 4.4.2 Offline
  5. 5 SECTION V: COMPETITIVE ANALYSIS
    1. 5.1 Competitive Landscape
      1. 5.1.1 Overview
      2. 5.1.2 Competitive Analysis
      3. 5.1.3 Market share Analysis
      4. 5.1.4 Major Growth Strategy in the Construction
      5. 5.1.5 Competitive Benchmarking
      6. 5.1.6 Leading Players in Terms of Number of Developments in the Construction
      7. 5.1.7 Key developments and growth strategies
        1. 5.1.7.1 New Product Launch/Service Deployment
        2. 5.1.7.2 Merger & Acquisitions
        3. 5.1.7.3 Joint Ventures
      8. 5.1.8 Major Players Financial Matrix
        1. 5.1.8.1 Sales and Operating Income
        2. 5.1.8.2 Major Players R&D Expenditure. 2023
    2. 5.2 Company Profiles
      1. 5.2.1 Spectrum Brands (US)
        1. 5.2.1.1 Financial Overview
        2. 5.2.1.2 Products Offered
        3. 5.2.1.3 Key Developments
        4. 5.2.1.4 SWOT Analysis
        5. 5.2.1.5 Key Strategies
      2. 5.2.2 Tetra (DE)
        1. 5.2.2.1 Financial Overview
        2. 5.2.2.2 Products Offered
        3. 5.2.2.3 Key Developments
        4. 5.2.2.4 SWOT Analysis
        5. 5.2.2.5 Key Strategies
      3. 5.2.3 Aquatic Eco-Systems (US)
        1. 5.2.3.1 Financial Overview
        2. 5.2.3.2 Products Offered
        3. 5.2.3.3 Key Developments
        4. 5.2.3.4 SWOT Analysis
        5. 5.2.3.5 Key Strategies
      4. 5.2.4 Hagen (CA)
        1. 5.2.4.1 Financial Overview
        2. 5.2.4.2 Products Offered
        3. 5.2.4.3 Key Developments
        4. 5.2.4.4 SWOT Analysis
        5. 5.2.4.5 Key Strategies
      5. 5.2.5 Eheim (DE)
        1. 5.2.5.1 Financial Overview
        2. 5.2.5.2 Products Offered
        3. 5.2.5.3 Key Developments
        4. 5.2.5.4 SWOT Analysis
        5. 5.2.5.5 Key Strategies
      6. 5.2.6 Fluval (CA)
        1. 5.2.6.1 Financial Overview
        2. 5.2.6.2 Products Offered
        3. 5.2.6.3 Key Developments
        4. 5.2.6.4 SWOT Analysis
        5. 5.2.6.5 Key Strategies
      7. 5.2.7 Marina (CA)
        1. 5.2.7.1 Financial Overview
        2. 5.2.7.2 Products Offered
        3. 5.2.7.3 Key Developments
        4. 5.2.7.4 SWOT Analysis
        5. 5.2.7.5 Key Strategies
      8. 5.2.8 Pondmaster (US)
        1. 5.2.8.1 Financial Overview
        2. 5.2.8.2 Products Offered
        3. 5.2.8.3 Key Developments
        4. 5.2.8.4 SWOT Analysis
        5. 5.2.8.5 Key Strategies
      9. 5.2.9 Seachem (US)
        1. 5.2.9.1 Financial Overview
        2. 5.2.9.2 Products Offered
        3. 5.2.9.3 Key Developments
        4. 5.2.9.4 SWOT Analysis
        5. 5.2.9.5 Key Strategies
    3. 5.3 Appendix
      1. 5.3.1 References
      2. 5.3.2 Related Reports
  6. 6 LIST OF FIGURES
    1. 6.1 MARKET SYNOPSIS
    2. 6.2 EUROPE MARKET ANALYSIS BY APPLICATION
    3. 6.3 EUROPE MARKET ANALYSIS BY PRODUCT TYPE
    4. 6.4 EUROPE MARKET ANALYSIS BY COMPONENT
    5. 6.5 EUROPE MARKET ANALYSIS BY DISTRIBUTION CHANNEL
    6. 6.6 KEY BUYING CRITERIA OF CONSTRUCTION
    7. 6.7 RESEARCH PROCESS OF MRFR
    8. 6.8 DRO ANALYSIS OF CONSTRUCTION
    9. 6.9 DRIVERS IMPACT ANALYSIS: CONSTRUCTION
    10. 6.10 RESTRAINTS IMPACT ANALYSIS: CONSTRUCTION
    11. 6.11 SUPPLY / VALUE CHAIN: CONSTRUCTION
    12. 6.12 CONSTRUCTION, BY APPLICATION, 2024 (% SHARE)
    13. 6.13 CONSTRUCTION, BY APPLICATION, 2024 TO 2035 (USD Million)
    14. 6.14 CONSTRUCTION, BY PRODUCT TYPE, 2024 (% SHARE)
    15. 6.15 CONSTRUCTION, BY PRODUCT TYPE, 2024 TO 2035 (USD Million)
    16. 6.16 CONSTRUCTION, BY COMPONENT, 2024 (% SHARE)
    17. 6.17 CONSTRUCTION, BY COMPONENT, 2024 TO 2035 (USD Million)
    18. 6.18 CONSTRUCTION, BY DISTRIBUTION CHANNEL, 2024 (% SHARE)
    19. 6.19 CONSTRUCTION, BY DISTRIBUTION CHANNEL, 2024 TO 2035 (USD Million)
    20. 6.20 BENCHMARKING OF MAJOR COMPETITORS
  7. 7 LIST OF TABLES
    1. 7.1 LIST OF ASSUMPTIONS
  8. 7.1.1
    1. 7.2 Europe MARKET SIZE ESTIMATES; FORECAST
      1. 7.2.1 BY APPLICATION, 2025-2035 (USD Million)
      2. 7.2.2 BY PRODUCT TYPE, 2025-2035 (USD Million)
      3. 7.2.3 BY COMPONENT, 2025-2035 (USD Million)
      4. 7.2.4 BY DISTRIBUTION CHANNEL, 2025-2035 (USD Million)
    2. 7.3 PRODUCT LAUNCH/PRODUCT DEVELOPMENT/APPROVAL
  9. 7.3.1
    1. 7.4 ACQUISITION/PARTNERSHIP
  10. 7.4.1

Europe Construction Market Segmentation

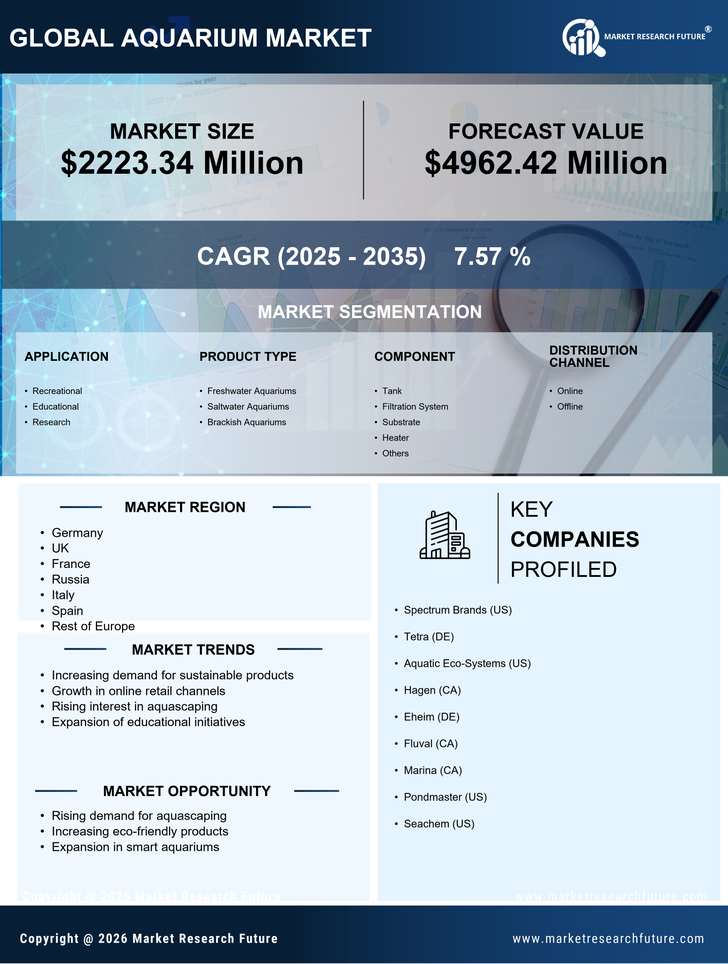
Construction By Application (USD Million, 2025-2035)

  • Recreational
  • Educational
  • Research

Construction By Product Type (USD Million, 2025-2035)

  • Freshwater Aquariums
  • Saltwater Aquariums
  • Brackish Aquariums

Construction By Component (USD Million, 2025-2035)

  • Tank
  • Filtration System
  • Substrate
  • Heater
  • Others

Construction By Distribution Channel (USD Million, 2025-2035)

  • Online
  • Offline