Europe Advanced Distribution Management Systems Market

ID: MRFR/ICT/59850-HCR
200 Pages
Nirmit Biswas
Last Updated: February 06, 2026
Europe Advanced Distribution Management Systems Market Size, Share and Research Report: By Application (Distribution Network Management, Load Management, Power Quality Management, Grid Automation), By Deployment Type (On-Premise, Cloud-Based, Hybrid), By Component (Software, Services, Support and Maintenance), By End Use (Utilities, Renewable Energy Providers, Industrial) and By Regional (Germany, UK, France, Russia, Italy, Spain, Rest of Europe)-Forecast to 2035
Download PDF ×

We do not share your information with anyone. However, we may send you emails based on your report interest from time to time. You may contact us at any time to opt-out.

Europe Advanced Distribution Management Systems Market

Market Size

Forecast Period2025 - 2035
CAGR (2025 - 2035)5.03%
2024 Market Size$ 699.29 Million
2025 Market Size$ 734.47 Million
2035 Market Size$ 1,200 Million

Key Players

SAP
Oracle
IBM
Microsoft
JDA Software
Manhattan Associates
Opportunities
  • Growing E-commerce Sector
  • Rising Demand for Automation
  • Evolving Regulatory Frameworks
  1. 1 SECTION I: EXECUTIVE SUMMARY AND KEY HIGHLIGHTS
    1. 1.1 EXECUTIVE SUMMARY
      1. 1.1.1 Market Overview
      2. 1.1.2 Key Findings
      3. 1.1.3 Market Segmentation
      4. 1.1.4 Competitive Landscape
      5. 1.1.5 Challenges and Opportunities
      6. 1.1.6 Future Outlook
  2. 2 SECTION II: SCOPING, METHODOLOGY AND MARKET STRUCTURE
    1. 2.1 MARKET INTRODUCTION
      1. 2.1.1 Definition
      2. 2.1.2 Scope of the study
        1. 2.1.2.1 Research Objective
        2. 2.1.2.2 Assumption
        3. 2.1.2.3 Limitations
    2. 2.2 RESEARCH METHODOLOGY
      1. 2.2.1 Overview
      2. 2.2.2 Data Mining
      3. 2.2.3 Secondary Research
      4. 2.2.4 Primary Research
        1. 2.2.4.1 Primary Interviews and Information Gathering Process
        2. 2.2.4.2 Breakdown of Primary Respondents
      5. 2.2.5 Forecasting Model
      6. 2.2.6 Market Size Estimation
        1. 2.2.6.1 Bottom-Up Approach
        2. 2.2.6.2 Top-Down Approach
      7. 2.2.7 Data Triangulation
      8. 2.2.8 Validation
  3. 3 SECTION III: QUALITATIVE ANALYSIS
    1. 3.1 MARKET DYNAMICS
      1. 3.1.1 Overview
      2. 3.1.2 Drivers
      3. 3.1.3 Restraints
      4. 3.1.4 Opportunities
    2. 3.2 MARKET FACTOR ANALYSIS
      1. 3.2.1 Value chain Analysis
      2. 3.2.2 Porter's Five Forces Analysis
        1. 3.2.2.1 Bargaining Power of Suppliers
        2. 3.2.2.2 Bargaining Power of Buyers
        3. 3.2.2.3 Threat of New Entrants
        4. 3.2.2.4 Threat of Substitutes
        5. 3.2.2.5 Intensity of Rivalry
      3. 3.2.3 COVID-19 Impact Analysis
        1. 3.2.3.1 Market Impact Analysis
        2. 3.2.3.2 Regional Impact
        3. 3.2.3.3 Opportunity and Threat Analysis
  4. 4 SECTION IV: QUANTITATIVE ANALYSIS
    1. 4.1 Information and Communications Technology, BY Application (USD Million)
      1. 4.1.1 Grid Management
      2. 4.1.2 Distributed Energy Resource Management
      3. 4.1.3 Demand Response Management
      4. 4.1.4 Outage Management
      5. 4.1.5 Voltage Control
    2. 4.2 Information and Communications Technology, BY End Use (USD Million)
      1. 4.2.1 Utilities
      2. 4.2.2 Commercial
      3. 4.2.3 Industrial
      4. 4.2.4 Residential
    3. 4.3 Information and Communications Technology, BY Deployment Type (USD Million)
      1. 4.3.1 On-Premises
      2. 4.3.2 Cloud-Based
      3. 4.3.3 Hybrid
    4. 4.4 Information and Communications Technology, BY Component (USD Million)
      1. 4.4.1 Software
      2. 4.4.2 Services
      3. 4.4.3 Hardware
    5. 4.5 Information and Communications Technology, BY Technology (USD Million)
      1. 4.5.1 Artificial Intelligence
      2. 4.5.2 Machine Learning
      3. 4.5.3 Internet of Things
      4. 4.5.4 Big Data Analytics
  5. 5 SECTION V: COMPETITIVE ANALYSIS
    1. 5.1 Competitive Landscape
      1. 5.1.1 Overview
      2. 5.1.2 Competitive Analysis
      3. 5.1.3 Market share Analysis
      4. 5.1.4 Major Growth Strategy in the Information and Communications Technology
      5. 5.1.5 Competitive Benchmarking
      6. 5.1.6 Leading Players in Terms of Number of Developments in the Information and Communications Technology
      7. 5.1.7 Key developments and growth strategies
        1. 5.1.7.1 New Product Launch/Service Deployment
        2. 5.1.7.2 Merger & Acquisitions
        3. 5.1.7.3 Joint Ventures
      8. 5.1.8 Major Players Financial Matrix
        1. 5.1.8.1 Sales and Operating Income
        2. 5.1.8.2 Major Players R&D Expenditure. 2023
    2. 5.2 Company Profiles
      1. 5.2.1 Siemens (DE)
        1. 5.2.1.1 Financial Overview
        2. 5.2.1.2 Products Offered
        3. 5.2.1.3 Key Developments
        4. 5.2.1.4 SWOT Analysis
        5. 5.2.1.5 Key Strategies
      2. 5.2.2 Schneider Electric (FR)
        1. 5.2.2.1 Financial Overview
        2. 5.2.2.2 Products Offered
        3. 5.2.2.3 Key Developments
        4. 5.2.2.4 SWOT Analysis
        5. 5.2.2.5 Key Strategies
      3. 5.2.3 GE Digital (US)
        1. 5.2.3.1 Financial Overview
        2. 5.2.3.2 Products Offered
        3. 5.2.3.3 Key Developments
        4. 5.2.3.4 SWOT Analysis
        5. 5.2.3.5 Key Strategies
      4. 5.2.4 ABB (CH)
        1. 5.2.4.1 Financial Overview
        2. 5.2.4.2 Products Offered
        3. 5.2.4.3 Key Developments
        4. 5.2.4.4 SWOT Analysis
        5. 5.2.4.5 Key Strategies
      5. 5.2.5 Oracle (US)
        1. 5.2.5.1 Financial Overview
        2. 5.2.5.2 Products Offered
        3. 5.2.5.3 Key Developments
        4. 5.2.5.4 SWOT Analysis
        5. 5.2.5.5 Key Strategies
      6. 5.2.6 Honeywell (US)
        1. 5.2.6.1 Financial Overview
        2. 5.2.6.2 Products Offered
        3. 5.2.6.3 Key Developments
        4. 5.2.6.4 SWOT Analysis
        5. 5.2.6.5 Key Strategies
      7. 5.2.7 IBM (US)
        1. 5.2.7.1 Financial Overview
        2. 5.2.7.2 Products Offered
        3. 5.2.7.3 Key Developments
        4. 5.2.7.4 SWOT Analysis
        5. 5.2.7.5 Key Strategies
      8. 5.2.8 SAP (DE)
        1. 5.2.8.1 Financial Overview
        2. 5.2.8.2 Products Offered
        3. 5.2.8.3 Key Developments
        4. 5.2.8.4 SWOT Analysis
        5. 5.2.8.5 Key Strategies
      9. 5.2.9 Landis+Gyr (CH)
        1. 5.2.9.1 Financial Overview
        2. 5.2.9.2 Products Offered
        3. 5.2.9.3 Key Developments
        4. 5.2.9.4 SWOT Analysis
        5. 5.2.9.5 Key Strategies
    3. 5.3 Appendix
      1. 5.3.1 References
      2. 5.3.2 Related Reports
  6. 6 LIST OF FIGURES
    1. 6.1 MARKET SYNOPSIS
    2. 6.2 EUROPE MARKET ANALYSIS BY APPLICATION
    3. 6.3 EUROPE MARKET ANALYSIS BY END USE
    4. 6.4 EUROPE MARKET ANALYSIS BY DEPLOYMENT TYPE
    5. 6.5 EUROPE MARKET ANALYSIS BY COMPONENT
    6. 6.6 EUROPE MARKET ANALYSIS BY TECHNOLOGY
    7. 6.7 KEY BUYING CRITERIA OF INFORMATION AND COMMUNICATIONS TECHNOLOGY
    8. 6.8 RESEARCH PROCESS OF MRFR
    9. 6.9 DRO ANALYSIS OF INFORMATION AND COMMUNICATIONS TECHNOLOGY
    10. 6.10 DRIVERS IMPACT ANALYSIS: INFORMATION AND COMMUNICATIONS TECHNOLOGY
    11. 6.11 RESTRAINTS IMPACT ANALYSIS: INFORMATION AND COMMUNICATIONS TECHNOLOGY
    12. 6.12 SUPPLY / VALUE CHAIN: INFORMATION AND COMMUNICATIONS TECHNOLOGY
    13. 6.13 INFORMATION AND COMMUNICATIONS TECHNOLOGY, BY APPLICATION, 2024 (% SHARE)
    14. 6.14 INFORMATION AND COMMUNICATIONS TECHNOLOGY, BY APPLICATION, 2024 TO 2035 (USD Million)
    15. 6.15 INFORMATION AND COMMUNICATIONS TECHNOLOGY, BY END USE, 2024 (% SHARE)
    16. 6.16 INFORMATION AND COMMUNICATIONS TECHNOLOGY, BY END USE, 2024 TO 2035 (USD Million)
    17. 6.17 INFORMATION AND COMMUNICATIONS TECHNOLOGY, BY DEPLOYMENT TYPE, 2024 (% SHARE)
    18. 6.18 INFORMATION AND COMMUNICATIONS TECHNOLOGY, BY DEPLOYMENT TYPE, 2024 TO 2035 (USD Million)
    19. 6.19 INFORMATION AND COMMUNICATIONS TECHNOLOGY, BY COMPONENT, 2024 (% SHARE)
    20. 6.20 INFORMATION AND COMMUNICATIONS TECHNOLOGY, BY COMPONENT, 2024 TO 2035 (USD Million)
    21. 6.21 INFORMATION AND COMMUNICATIONS TECHNOLOGY, BY TECHNOLOGY, 2024 (% SHARE)
    22. 6.22 INFORMATION AND COMMUNICATIONS TECHNOLOGY, BY TECHNOLOGY, 2024 TO 2035 (USD Million)
    23. 6.23 BENCHMARKING OF MAJOR COMPETITORS
  7. 7 LIST OF TABLES
    1. 7.1 LIST OF ASSUMPTIONS
  8. 7.1.1
    1. 7.2 Europe MARKET SIZE ESTIMATES; FORECAST
      1. 7.2.1 BY APPLICATION, 2026-2035 (USD Million)
      2. 7.2.2 BY END USE, 2026-2035 (USD Million)
      3. 7.2.3 BY DEPLOYMENT TYPE, 2026-2035 (USD Million)
      4. 7.2.4 BY COMPONENT, 2026-2035 (USD Million)
      5. 7.2.5 BY TECHNOLOGY, 2026-2035 (USD Million)
    2. 7.3 PRODUCT LAUNCH/PRODUCT DEVELOPMENT/APPROVAL
  9. 7.3.1
    1. 7.4 ACQUISITION/PARTNERSHIP
  10. 7.4.1

Europe Europe Advanced Distribution Management Systems Market Segmentation

Europe Advanced Distribution Management Systems Market By Application (USD Million, 2022-2035)
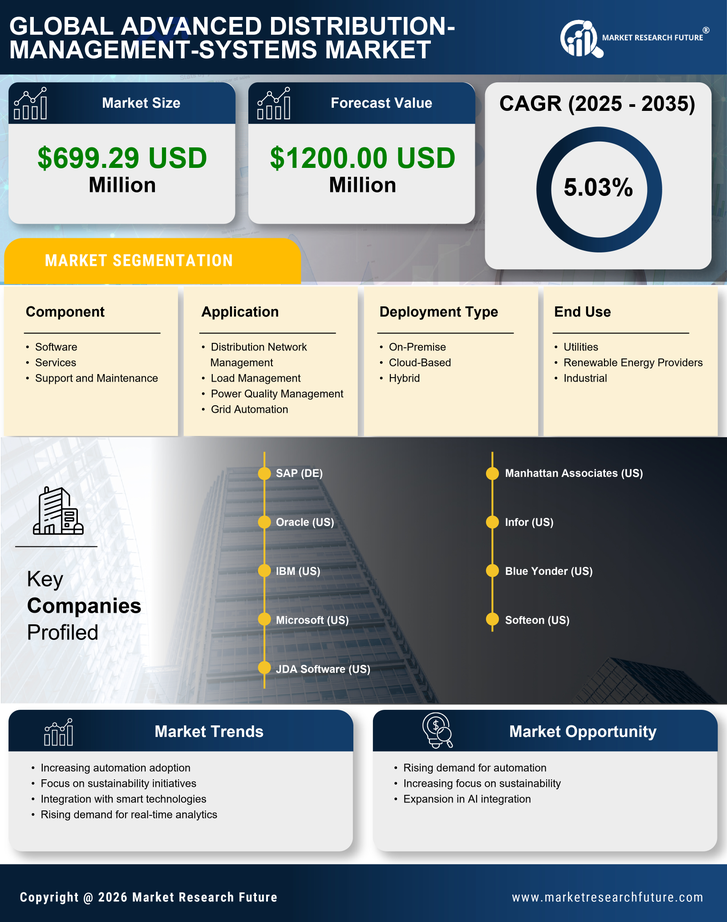
  • Grid Management
  • Distributed Energy Resource Management
  • Demand Response Management
  • Outage Management
  • Voltage Control

Europe Advanced Distribution Management Systems Market By End Use (USD Million, 2022-2035)

  • Utilities
  • Commercial
  • Industrial
  • Residential

Europe Advanced Distribution Management Systems Market By Deployment Type (USD Million, 2022-2035)

  • On-Premises
  • Cloud-Based
  • Hybrid

Europe Advanced Distribution Management Systems Market By Component (USD Million, 2022-2035)

  • Software
  • Services
  • Hardware

Europe Advanced Distribution Management Systems Market By Technology (USD Million, 2022-2035)

  • Artificial Intelligence
  • Machine Learning
  • Internet of Things
  • Big Data Analytics