Ethyl Acetate Market (2026 - 2035)

ID: MRFR/CnM/0439-HCR 111 Pages Chitranshi Jaiswal Last Updated: November 07, 2026
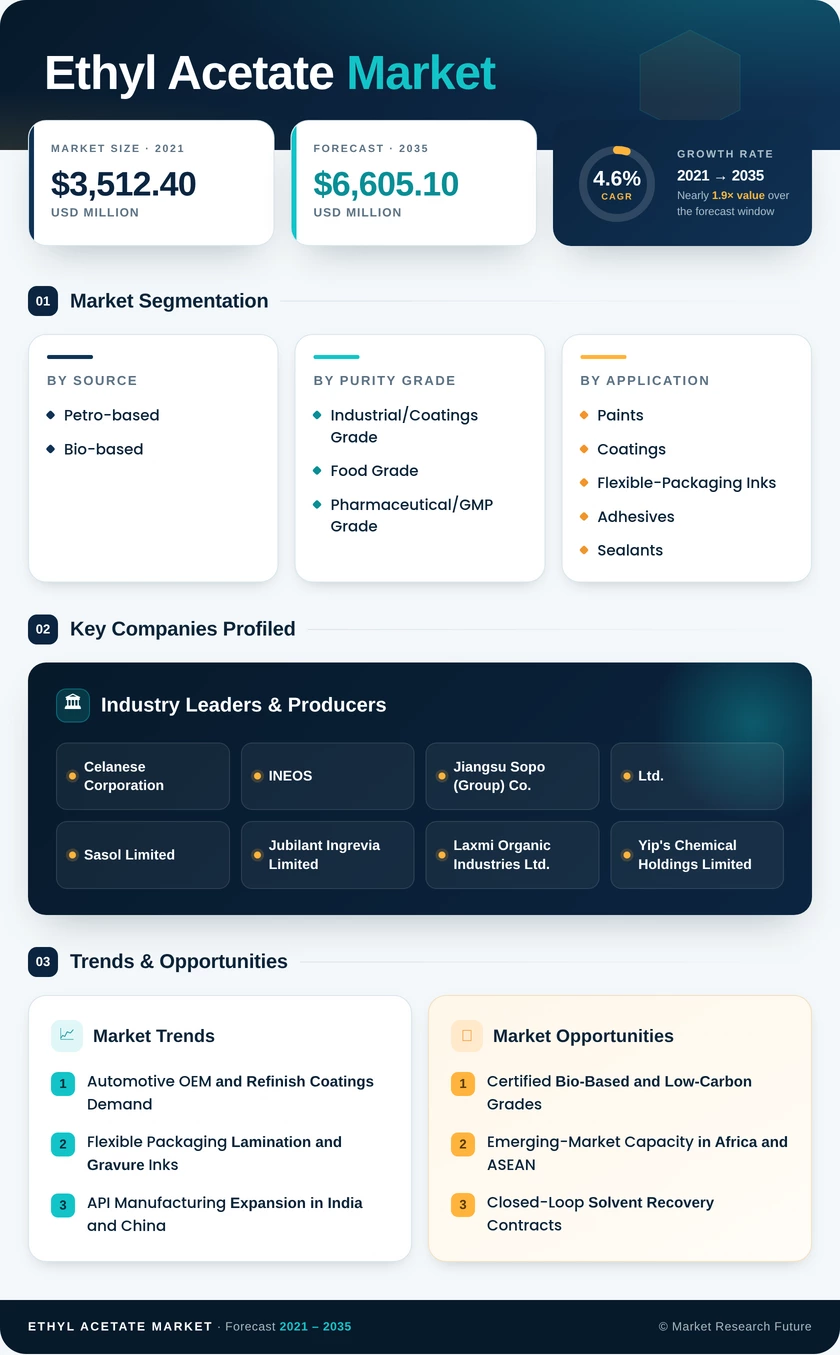
Ethyl Acetate Market Research Report Information By Source (Petro-based and Bio-based), By Purity Grade (Industrial/Coatings Grade, Food Grade, and Pharmaceutical/GMP Grade), By Application (Paints and Coatings, Flexible-Packaging Inks, Adhesives and Sealants, Pigments and Dyes, Process Solvents, and Other Applications), By End-User Industry (Automotive, Artificial Leather, Food and Beverage, Pharmaceuticals, and Other End-User Industries), And By Region (North America, Europe, Asia-Pacific, and Rest of the World) – Market Forecast Till 2035.
Ethyl Acetate Market
Market Size
Forecast Period2026-2035
CAGR (2026-2035)4.6%
2025 Market SizeUSD 4,212.6 Million
2035 Market SizeUSD 6,605.1 Million
Key Players
Celanese Corporation
INEOS
Jiangsu Sopo Co., Ltd.
Sasol Limited
Jubilant Ingrevia Limited
Laxmi Organic Industries Ltd.
Opportunities
  • Certified Bio-Based and Low-Carbon Grades
  • Emerging-Market Capacity in Africa and ASEAN
  • Closed-Loop Solvent Recovery Contracts
  1. 1 Market Summary | |
  2. 2 Key Report Takeaways | |
    1. 2.1 By Source | |
    2. 2.2 By Purity Grade | |
    3. 2.3 By Application | |
    4. 2.4 By End-user Industry | |
    5. 2.5 By Region | |
  3. 3 Market Size and Forecast (2021–2035) | |
  4. 4 Driver Impact Analysis | |
    1. 4.1 Automotive OEM and Refinish Coatings Demand | |
    2. 4.2 Flexible Packaging Lamination and Gravure Inks | |
    3. 4.3 API Manufacturing Expansion in India and China | |
    4. 4.4 Decaffeination and Flavor Extraction | |
    5. 4.5 Regulatory Phase-Out of Aromatic and HAP Solvents | |
    6. 4.6 Brand-Owner Demand for Certified Bio-Based Grades | |
  5. 5 Restraints Impact Analysis | |
    1. 5.1 Feedstock Price Volatility | |
    2. 5.2 Water-Borne and Solvent-Free Substitution | |
    3. 5.3 Overcapacity and Trade Remedies | |
    4. 5.4 Flammability and Handling Compliance | |
    5. 5.5 Carbon Cost Exposure | |
  6. 6 Opportunities | |
    1. 6.1 Certified Bio-Based and Low-Carbon Grades | |
    2. 6.2 Emerging-Market Capacity in Africa and ASEAN | |
    3. 6.3 Closed-Loop Solvent Recovery Contracts | |
    4. 6.4 GMP-Grade Supply for CDMOs | |
    5. 6.5 Electronics and Battery Applications | |
  7. 7 Regional Market Share and Country-Level Analysis | |
    1. 7.1 Asia-Pacific | | |
      1. 7.1.1 China | | |
      2. 7.1.2 India | | |
      3. 7.1.3 Japan | | |
      4. 7.1.4 South Korea | | |
      5. 7.1.5 ASEAN Countries | | |
      6. 7.1.6 Rest of Asia-Pacific | |
    2. 7.2 North America | | |
      1. 7.2.1 United States | | |
      2. 7.2.2 Canada | | |
      3. 7.2.3 Mexico | |
    3. 7.3 Europe | | |
      1. 7.3.1 Germany | | |
      2. 7.3.2 United Kingdom | | |
      3. 7.3.3 France | | |
      4. 7.3.4 Italy | | |
      5. 7.3.5 NORDIC Countries | | |
      6. 7.3.6 Rest of Europe | |
    4. 7.4 South America | | |
      1. 7.4.1 Brazil | | |
      2. 7.4.2 Argentina | | |
      3. 7.4.3 Rest of South America | |
    5. 7.5 Middle East and Africa | | |
      1. 7.5.1 Saudi Arabia | | |
      2. 7.5.2 United Arab Emirates | | |
      3. 7.5.3 South Africa | | |
      4. 7.5.4 Nigeria | | |
      5. 7.5.5 Rest of Middle East and Africa | |
  8. 8 Future Outlook (2026–2035) | |
    1. 8.1 Feedstock Decarbonization | |
    2. 8.2 Regulation-Led Reformulation | |
    3. 8.3 Digitalized Process Control | |
    4. 8.4 Trade Regionalization and Supply Security | |
  9. 9 Segmentation Analysis | |
    1. 9.1 By Source | | |
      1. 9.1.1 Petro-based | | |
      2. 9.1.2 Bio-based | |
    2. 9.2 By Purity Grade | | |
      1. 9.2.1 Industrial/Coatings Grade | | |
      2. 9.2.2 Food Grade | | |
      3. 9.2.3 Pharmaceutical/GMP Grade | |
    3. 9.3 By Application | | |
      1. 9.3.1 Paints and Coatings | | |
      2. 9.3.2 Flexible-Packaging Inks | | |
      3. 9.3.3 Adhesives and Sealants | | |
      4. 9.3.4 Pigments and Dyes | | |
      5. 9.3.5 Process Solvents | | |
      6. 9.3.6 Other Applications (Flavor and Fragrance Enhancers, Inks) | |
    4. 9.4 By End-user Industry | | |
      1. 9.4.1 Automotive | | |
      2. 9.4.2 Artificial Leather | | |
      3. 9.4.3 Food and Beverage | | |
      4. 9.4.4 Pharmaceuticals | | |
      5. 9.4.5 Other End-user Industries (Packaging) | |
  10. 10 Competitive Landscape | |
    1. 10.1 Market Concentration Analysis | |
    2. 10.2 Competitive Benchmarking Matrix | |
    3. 10.3 Company Profiles | | |
      1. 10.3.1 Celanese Corporation | | |
      2. 10.3.2 INEOS | | |
      3. 10.3.3 Jiangsu Sopo (Group) Co., Ltd. | | |
      4. 10.3.4 Sasol Limited | | |
      5. 10.3.5 Jubilant Ingrevia Limited | | |
      6. 10.3.6 Laxmi Organic Industries Ltd. | | |
      7. 10.3.7 Eastman Chemical Company | | |
      8. 10.3.8 Yip's Chemical Holdings Limited | | |
      9. 10.3.9 Daicel Corporation | | |
      10. 10.3.10 Godavari Biorefineries Ltd. | | |
      11. 10.3.11 SEKAB | |
  11. 11 Recent News & Developments | |
  12. 12 Report Scope and Methodology | |
  13. 13 Detailed Sources and Citations | |
  14. 14 Frequently Asked Questions (FAQs) | | LIST OF TABLES | |
  15. TABLE 1 Market Snapshot, 2025–2035 | |
  16. TABLE 2 Global Market Size and Forecast, by Revenue (USD Million), 2021–2035 | |
  17. TABLE 3 Driver Impact Analysis | |
  18. TABLE 4 Restraints Impact Analysis | |
  19. TABLE 5 Regional Summary, 2025 | |
  20. TABLE 6 Asia-Pacific Market, by Country, 2025 | |
  21. TABLE 7 North America Market, by Country, 2025 | |
  22. TABLE 8 Europe Market, by Country, 2025 | |
  23. TABLE 9 South America Market, by Country, 2025 | |
  24. TABLE 10 Middle East and Africa Market, by Country, 2025 | |
  25. TABLE 11 Global Market, by Source, 2025 | |
  26. TABLE 12 Global Market, by Purity Grade, 2025 | |
  27. TABLE 13 Global Market, by Application, 2025 | |
  28. TABLE 14 Global Market, by End-user Industry, 2025 | |
  29. TABLE 15 Competitive Benchmarking Matrix, 2025 | |
  30. TABLE 16 Report Scope and Methodology | |
  31. TABLE 17 Detailed Sources and Citations | |
  32. TABLE 18 Segmentation Quick Reference | | LIST OF FIGURES | |
  33. FIGURE 1 Market Dynamics Overview (Drivers, Restraints, Opportunities) | |
  34. FIGURE 2 Industry Value Chain Analysis | |
  35. FIGURE 3 Porter's Five Forces Analysis | |
  36. FIGURE 4 Global Market Size Trend, 2021–2035 (USD Million) | |
  37. FIGURE 5 Year-over-Year Growth Rate, 2021–2035 | |
  38. FIGURE 6 Market Share by Source, 2025 | |
  39. FIGURE 7 Market Share by Purity Grade, 2025 | |
  40. FIGURE 8 Market Share by Application, 2025 | |
  41. FIGURE 9 Market Share by End-user Industry, 2025 | |
  42. FIGURE 10 Regional Market Share, 2025 | |
  43. FIGURE 11 Regional Growth Comparison, 2026–2035 | |
  44. FIGURE 12 Competitive Landscape Positioning Map, 2025

Segmentation Quick Reference

DimensionSub-SegmentsDominant SegmentFastest Growing Segment
By SourcePetro-based, Bio-basedPetro-based (85.6% share)Bio-based (6.8% CAGR)
By Purity GradeIndustrial/Coatings Grade, Food Grade, Pharmaceutical/GMP GradeIndustrial/Coatings Grade (63.6% share)Pharmaceutical/GMP Grade (5.7% CAGR)
By ApplicationPaints and Coatings, Flexible-Packaging Inks, Adhesives and Sealants, Pigments and Dyes, Process Solvents, Other Applications (Flavor and Fragrance Enhancers, Inks)Paints and Coatings (56.5% share)Adhesives and Sealants (5.6% CAGR)
By End-user IndustryAutomotive, Artificial Leather, Food and Beverage, Pharmaceuticals, Other End-user Industries (Packaging)Automotive (49.3% share)Food and Beverage (5.5% CAGR)
By RegionAsia-Pacific, North America, Europe, South America, Middle East and AfricaAsia-Pacific (58.6% share)North America (5.1% CAGR)

Market Segmentation Overview

By Source

Sub-SegmentKey Trend
Petro-basedScale-advantaged esterification and acetaldehyde routes integrated with acetic acid
Bio-basedISCC PLUS and USDA-certified grades entering brand-owner supply contracts

Petro-based production leads because integrated acetic acid and ethanol supply keep cash costs low, especially at Chinese export plants. Bio-based grades are growing fastest as packaging and personal-care buyers write verified renewable content into tenders. Partial-content drop-in products such as ECO-B narrow the price gap, while fully renewable producers like Godavari serve buyers who need measured biogenic carbon.

By Purity Grade

Sub-SegmentKey Trend
Industrial/Coatings GradeHigh-volume supply to coatings, inks and laminating lines
Food GradeDecaffeination and flavor extraction under FDA and EU clearances
Pharmaceutical/GMP GradeUSP and Ph. Eur. compliant supply for API synthesis

Industrial/Coatings Grade dominates volume because paint and ink formulators accept standard specifications at the lowest price. Pharmaceutical/GMP Grade grows fastest, driven by PLI-backed API plants in India and CDMO expansion in China that require audit-ready documentation. Food Grade occupies a steady middle ground, protected by regulatory clearances that make it hard to substitute in decaffeination.

By Application

Sub-SegmentKey Trend
Paints and CoatingsAutomotive OEM recovery and architectural demand in emerging economies
Flexible-Packaging InksGravure and flexographic press speed gains on film substrates
Adhesives and SealantsSolvent-based polyurethane lamination for multilayer barrier packaging
Pigments and DyesDispersion solvent for advanced pigment formulations
Process SolventsExtraction and crystallization in pharmaceutical synthesis
Other Applications (Flavor and Fragrance Enhancers, Inks)Personal-care and flavor formulation uses

Paints and Coatings leads because automotive and architectural formulators depend on the solvent's evaporation profile and HAP-free status. Adhesives and Sealants grow fastest as e-commerce and convenience food formats expand multilayer laminate output. Flexible-Packaging Inks and Process Solvents add resilient demand that offsets water-borne substitution in European decorative paint.

By End-user Industry

Sub-SegmentKey Trend
AutomotiveOEM paint shops, refinish channels and interior bonding
Artificial LeatherPolyurethane coatings for footwear and upholstery
Food and BeverageDecaffeination capacity growth and low-alcohol beverage reformulation
PharmaceuticalsGMP-grade synthesis solvent for APIs
Other End-user Industries (Packaging)Cleaning and converting operations

Automotive remains the dominant end user because OEM and refinish coatings consume solvent at every paint layer. Food and Beverage grows fastest as decaffeination capacity expands in Asia-Pacific and beverage makers reformulate low-alcohol products that need flavor extraction. Pharmaceuticals and Artificial Leather provide steady specialty volume that smooths the automotive cycle.


Download PDF ×

We do not share your information with anyone. However, we may send you emails based on your report interest from time to time. You may contact us at any time to opt-out.